
The U.S. economy is very dynamic, with various factors driving supply and demand (see our Economics 101 course). In my opinion, the U.S. economy is like a very large ship, making it tough to change directions, even if various factors can impact it. If the economy is on a positive trajectory, it’s tough to reverse that course. That’s what we continue to see in today’s economic environment.
U.S. GDP Shows Resilience
According to the U.S. Bureau of Economic Analysis, U.S. Gross Domestic Product (GDP) continues to show moderate growth in Q2, with real GDP year-over-year growth of 2.4%, outperforming general expectations. On a quarter-over-quarter basis, real GDP grew 0.6%.1 When GDP is announced in the news, the GDP measure is usually refers to the real GDP number, which tries to take out the impact of inflation. Nominal GDP, which includes inflation, showed year-over-year growth of 6.3%.4 You can read the U.S. Bureau of Economic Analysis announcement here. This latest release is considered an “Advance Estimate”, the first of three GDP estimates released by the BEA. Data is revised two more times for the prior quarter as new data points come in.
The graph below is a nice reminder that the U.S. economy has been tough to bring down, with the exception of the COVID-19 pandemic. Good luck trying to time pandemics.
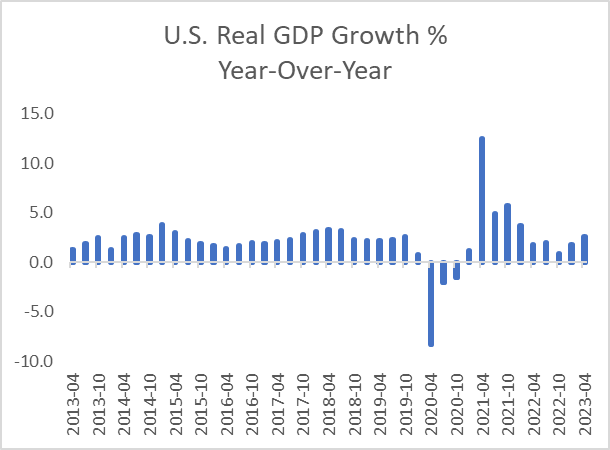
Source: U.S. Bureau of Economic Analysis. FRED.3
Quick Definition
Gross Domestic Product (GDP) is a measure of the economy and the aggregate demand for goods and services. There are a couple of nuanced definitions for GDP, based on either value created, total net spending, or the total income generated from individuals and businesses.
A simple math equation to use is:
GDP = Consumer Spending (C)+ Business Investments (I) + Government Spending (G) + Net Exports (exports – imports) (NX)
Inflation Continues to Decelerate
Inflation continues to come down as well, a positive for the economy and the broader financial markets. The Personal Consumption Expenditures (PCE) Index, which attempts to measure the change in prices consumers are paying, continued to show deceleration, with a +3% year-over-year increase in June, down from +3.8% in May. The “Core PCE” Index, which excludes volatile energy and food prices, decelerated from +4.6% to +4.1% in June.2 A slow and steady decline in high inflation is fine, not ideal, but the sustained direction is important. While most would like to see inflation decelerating much faster, we don’t always get what we want.
It is believed that the U.S. Federal Reserve likes to use the Core PCE Index as an indicator to determine how hot/cold inflation is on the economy. Under this belief, and a Fed “target” of 2% inflation, investors need to see Core PCE decline to the 2-3% range in order to feel more comfortable that the Fed is comfortable with the state of inflation and further monetary tightening is no longer needed.
I’m not getting overly hung up on what the current inflation number is, but rather focus on the intermediate term and my belief that inflation will continue to slowly decline back to a 2-3% (and potentially lower) range over time.
Fed Rate Hike Last Week
Last week the U.S. Federal Reserve raised the fed funds rate 0.25% (25 bps) to a target range of 5.25-5.50%. This was widely expected and markets appear to be pricing in a pause in rate hikes at this time. A still resilient economy and decelerating inflation (albeit slowly) indicates that the economy may be able to withstand current monetary tightening.
Companies are leaner, revenues are higher from price hikes, and input costs are rising at a lower pace, which means companies can still grow in this environment, at least for now. That’s a good sign.
Investment Implications
With the U.S. economy on a slow and steady pace and inflation continuing to show signs of deceleration, investors have less reason to be bearish over the short term. Remember, like the supply and demand for products and services driving the economy, supply and demand impact investment prices. If investors are less bearish and do not have material reasons to sell their investments (provide supply) and there are investors that still want to invest (demand) as new money comes into the system, demand exceeds supply and prices could remain stable and/or move higher from here, even after the rally this year.
Looking at U.S. Real GDP over time in the graph below, investors may have been better served to take advantage of investing in the broad U.S. economy than not. It is important to note, that a strong economy does not necessarily translate into strong investment performance (look at China economic growth and broad equity index investment performance). If you can find high quality investments that can take advantage of a growing economy, you may want to seriously consider taking advantage of those investments.
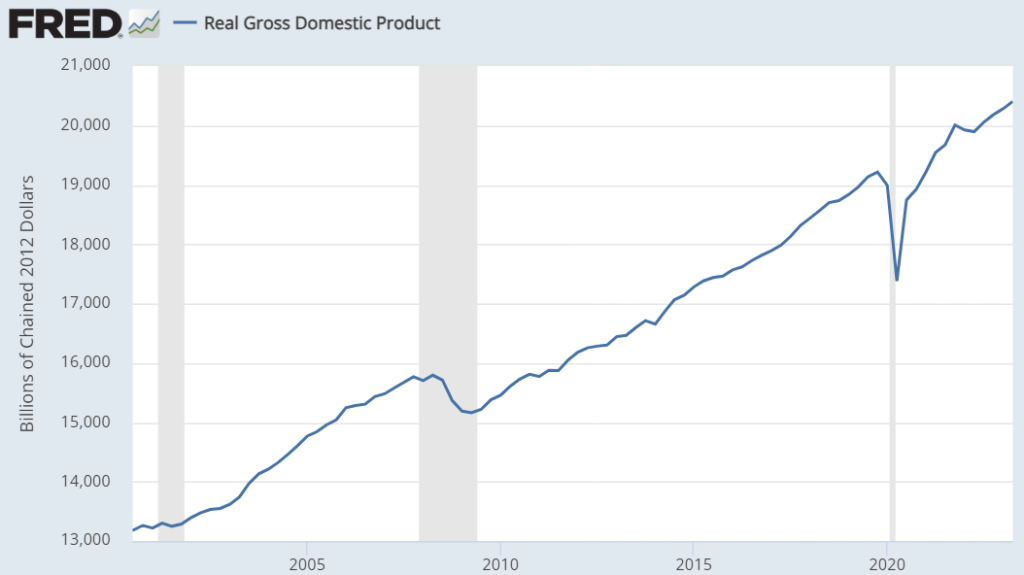
Source: U.S. Bureau of Economic Analysis. FRED.3
From a bond perspective, if inflation continues to show signs of cooling, the Fed may be able to pause its rate hikes. If rate hikes are paused, bond investors can enjoy higher yields for longer. If inflation declines at an accelerated pace and the economy starts to slow or enter a recession, interest rates may start to decline, which can push the prices of interest rate sensitive bonds higher. In either scenario, investors in high quality bonds could do well, all else equal.
So I think we’re in a period of “no bad news is good news”. I think it may take a decent shock to get investors to change from their current bullish perspective to a bearish one. If that is the case, and the markets decline for whatever reason, investors may be ready to buy the dips.
Sources
- U.S. Bureau of Economic Analysis. Gross Domestic Product, Second Quarter 2023 (Advance Estimate). July 27, 2023. Retrieved from https://www.bea.gov/news/2023/gross-domestic-product-second-quarter-2023-advance-estimate, July 31, 2023.
- U.S. Bureau of Economic Analysis. Personal Consumption Expenditures Price Index. Retrieved from https://www.bea.gov/news/2023/personal-income-and-outlays-june-2023, July 31, 2023.
- U.S. Bureau of Economic Analysis, Real Gross Domestic Product [GDPC1], retrieved from FRED, Federal Reserve Bank of St. Louis; https://fred.stlouisfed.org/series/GDPC1, July 31, 2023.
- U.S. Bureau of Economic Analysis, Gross Domestic Product [GDP], retrieved from FRED, Federal Reserve Bank of St. Louis; https://fred.stlouisfed.org/series/GDP, July 31, 2023.