Whenever I talk about technicals, particularly moving averages, I often use the term “squiggly lines”. Moving averages are literally lines on a chart that are automatically drawn/calculated, taking the average price of an investment over a specific time period. At a high level, these moving averages are often discussed at 50-day, 100-day and 200-day intervals. Most simple investment charts will include moving averages as indicators.
The scary part about these squiggly lines, is that investments actually move in price when they get close to the squiggly lines. In general, if an investment is above a squiggly line (moving average), it’s bullish. If below the squiggly line, it’s bearish. If it crosses above or below the squiggly line, it can signal a change in trend and violent prices moves can happen when it occurs.
My Problem with the Squiggly Lines
My problem with the squiggly lines is that anyone can use them as a trading signal. A child can determine whether an investment is in a positive or negative trend using these simple metrics. In my job, I hear professionals talking about the market or an investment being bullish or bearish, just based on the investment being above, below or crossing a moving average.
My problem: Professional and non-professional traders are using these very simple metrics to make a “bet” on the market, metrics a child can use. They are adding zero real value, but when they talk about it, they want to sound smart. If professionals, non-professionals, and children are looking at these squiggly lines to make investment decisions, then the market and investments will actually move based on these squiggly lines. It’s a self-fulfilling process. So while it’s somewhat ridiculous that the entire market can move based on squiggly lines, it is a real factor for the markets and any investment traded in the public markets. What you will see below is that the market does often respond to these squiggly lines and can help provide some potential reasons why the markets/investments are moving the way the are moving currently.
Squiggly Lines in Today’s Market Environment
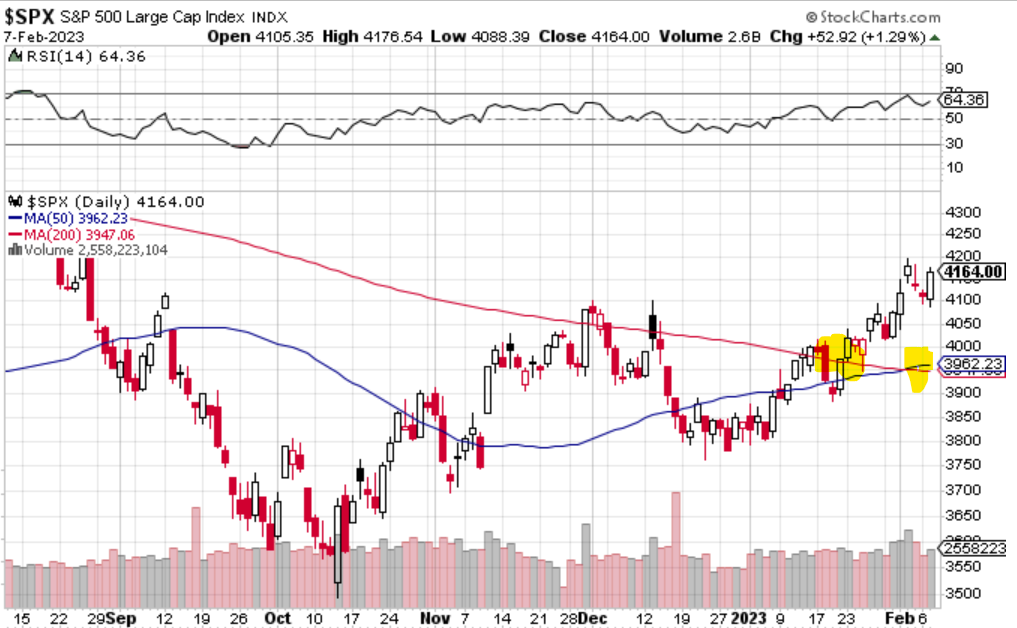
The last couple of weeks have been a period where market technicals may have continued to push equity markets higher. The 200-day moving average (squiggly line) is often considered a factor where technically-driven traders get bullish or bearish.
Here is a chart of the S&P 500…
Here is a chart of the NASDAQ 100…
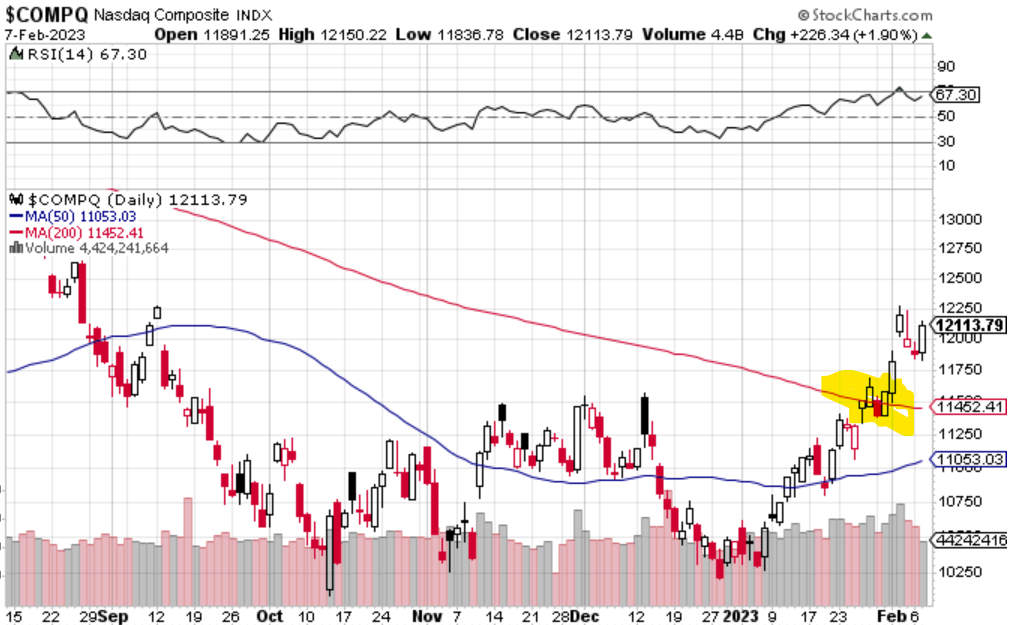
As you can clearly see, as the markets approached, then moved above the 200-day moving average, the market appeared to get more bullish. in this environment, bearish traders had to reverse their positions and become bullish, just based on these technicals. Bullish investors became even more bullish because of this bullish technical event.
Just based on these squiggly lines (the 200-day moving average), investors that follow these indicators need to remain bullish, whether they want to or not, if they are disciplined following these technicals. For this reason, even if the fundamentals may not be as bullish as they would suggest, if enough people are bullish just because the squiggly lines (technicals) indicated they should be bullish, the market may continue to remain bullish, or at least remain stable or not bearish.
If at some point the markets take a downturn and fall below the squiggly lines (the moving averages), traders that follow these technicals will be required to be bearish and sell their positions, betting the market will go down. This may cause volatility to spike when it occurs.
If you are a long-term investor, these short-term technical indicators don’t have to mean much and can be considered short-term noise. They are a good signal or reason to understand why there is short-term upside or downside movements in the markets/investments.
People often get confused how the market can be up or down so much in such a short time period. Often times these simple squiggly lines are the reason. It does not mean that anything structural or fundamental has changed.
Use this as a helpful reminder of some of the various reasons financial markets move the way they do. A knowledgeable investor is a better investor.