
SUMMARY
Well, the uncertainty of the elections is finally over, but the uncertainty of government policies remains. For the moment, investors are giving the Republican majority the benefit of the doubt.
In simplistic terms, without doing any deep work and taking a leap of faith, investors will tend to assume that a Republican majority across the White House and Congress is good for business and good for corporate America. This simple basic belief could put a floor under the U.S. equity markets and other risk assets. As long as enough investors believe this simple framework, it’s hard to be overly bearish on risk assets going into 2025.
Investors will want to keep an eye on the various economic metrics (GDP, inflation, tax revenue, labor supply, etc.) under the new Republican leadership to see if the anticipated policies as indicated during election season, actually play out. Investors that focus on fundamentals will be focused on these economic data points.
I wrote about the economic metrics to keep an eye on in my note posted on November 19, 2024 titled “After the Election: Setting the Goalposts”. These may be good baselines to see if politicians can actually execute what they promised to voters.
Ultimately we’ll need to wait and see what policies are actually implemented. While Republicans have control of the White House, there is only a slim majority in the House and Senate. I would assume there will be enough fighting between Republicans and Democrats and in-fighting within the Republican party that may result in a struggle for certain promised policies to actually be enacted into law.
Economy/Inflation
I think the U.S. economy can continue to generate moderate growth, maybe in the 1-3% real GDP growth range next year. The U.S. is a really big, dynamic economy, so it often takes big factors (significant fiscal / monetary policy changes, major geopolitical events, unexpected supply shocks, etc.) to get the economy out of that GDP growth range.
Inflation might stay in the 2-3% range, but Republican fiscal policies could put some upward pressure on inflation if tariffs and deportations (less labor supply) are higher than anticipated. If inflation sustains below 3%, the Fed may feel comfortable to continue to cut the fed funds rate next year. If it’s above 3%, then rate cuts might be tougher for the Fed to continue.
The current fed funds rate target range is 4.75%-4.50% as of this writing. The Federal Reserve is anticipated to cut the fed funds rate by 25 basis points (0.25%) in December and then maybe again in January or March next year. Assuming inflation continues to trend lower, maybe the fed funds rate gets to around 3.50%-4.00% by the end of 2025. The Fed will be data dependent, so we just need to keep an eye on inflation and the unemployment rate.
RISK ASSETS

As previously stated, it’s tough to be overly bearish on risk assets. It’s not just because of a potential tailwind from investors’ belief that Republicans are good for financial markets. It’s because fundamentals are still anticipated to be fairly stable and there are pockets of opportunity where valuations are still modestly attractive. For this reason, I’m still slightly bullish across risk assets.
My preferences to allocate capital haven’t changed, but I have reduced some risk. Looks like some speculative areas of the market are picking up speed, which could be signs of some froth and year-end performance chasing. That doesn’t often end well. I’m not a performance or junk chaser, but I do pay attention to it. Others can try the get rich quick route, I’m just not doing it.
I prefer to remain allocated to higher quality, growing companies across market cap and geography. Valuations in high-quality U.S. large caps appear stretched over the short term, but I’m willing to hold through periods of elevated valuations. With my diversification across potentially more attractive valuations in U.S. mid/small caps and internationally, I’m not just overly isolated to the valuation extremes of any one area of the market.
I still like diversification in higher income-generating assets as well. This includes option income strategies, closed end funds and higher income-generating credit-sensitive bonds. I can get potential income generation in the 6-8% range (sometimes higher depending on the strategy), plus price appreciation potential.
From a positioning perspective, I did reduce risk over the last three months as equity markets rallied. As you may have learned, I manage some strategies for clients (that I’m also invested in) that utilize leveraged ETFs in my U.S. Core X and Global Unconstrained strategies.
In my U.S. Core X strategy, following the rally, I am now at my minimum allocation to leverage. I had overweight leveraged positions to the NASDAQ and small caps but reduced those positions back to neutral following their rally to my targets. In my Global Unconstrained strategy, I heavily reduced my exposure to leveraged Chinese equities and my minor position to leveraged NASDAQ following rallies in those areas.
December can often be a part of the year with positive seasonality for risk assets and a rally can continue into year end. Investors may not want to sell due to not wanting to generate capital gains, especially now that the Trump tax cuts may be extended so maybe they don’t need to accelerate gains. Other tax-sensitive investors may not have many tax losses to harvest, so you don’t have that extra selling pressure into year end. Momentum traders may want to try to ride the momentum to year end. Some people may just use the first of the year as an arbitrary timeline to “finally” take some profits and hold off selling until next year. With these in mind, risk assets could continue to grind higher into the end of the year.
Be mindful that positive December seasonality is never guaranteed and I’ve seen bad endings to years as well. We’re already up a bunch this year, so I wouldn’t be surprised to see shorter-term investors/traders lock in profits, resulting in some downward price selling pressures, and call it a year.
In general, I have less exposure to risk overall than I’ve had over the last couple of years, but maintain diversified exposure across risk assets and maintain some tactical positions. I anticipate volatility to pick up again at some point, and I’ll try to take advantage of tactical rebalances and/or add risk if market drawdowns become deep enough.
U.S. EQUITIES
I remain slightly bullish on U.S. equities. As previously stated, I think there may be at least some sort of floor under the U.S. equity markets as long as investors believe Republicans are good for U.S. equity markets and that policies will be actually implemented to support U.S. companies (low taxes, stronger competitive position, less costly regulations, etc.).
To be clear, I think a floor could still allow the equity markets to decline a good amount, but that floor could trigger longer-term investors like myself to come in and buy high quality equities.
In my opinion, valuations in larger cap companies remain elevated, but there may still be some opportunities across mid and small caps. Valuations are often driven by sentiment in the short term as positive price momentum continues to bring in more buyers (fear of missing out or don’t want to sell early) and overpowers investors’ desire for better valuations based on underlying fundamentals (earnings, cash flow, yield, etc.).
Since I’m a long-term investor, I’m willing to hold high quality equities through some periods of what I believe to be extended valued equity markets, like what I believe we are in now. I also remain diversified across areas where valuations are more modest, so some of the valuation risk might be reduced.
Let’s look at some valuation metrics, just so you can see some of the things that I see…
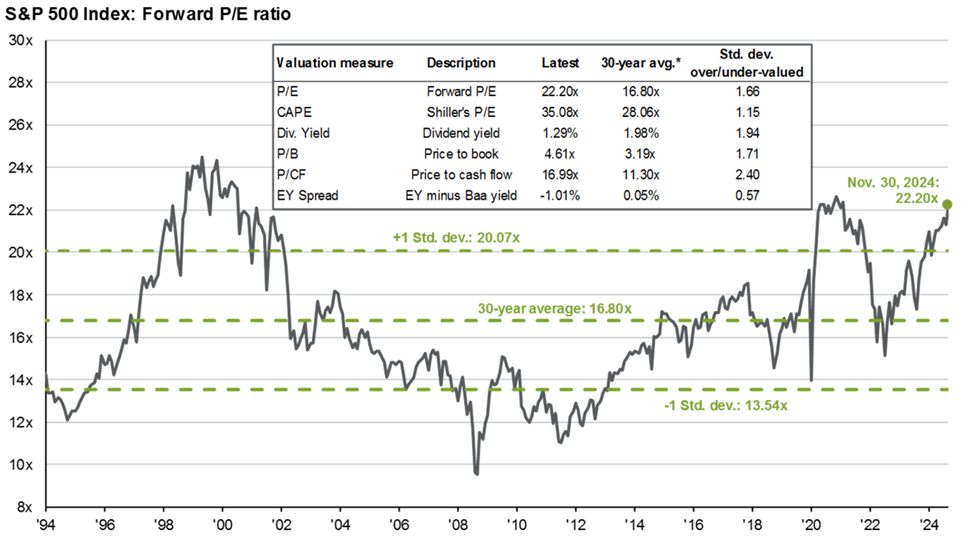
In the graph below, you can see that the S&P 500 forward price-to-earnings (P/E) ratio is towards the higher end of the historical 30-year range. Other valuation metrics also indicate higher levels than they have been in the past. Something to at least be aware of if you aren’t already.
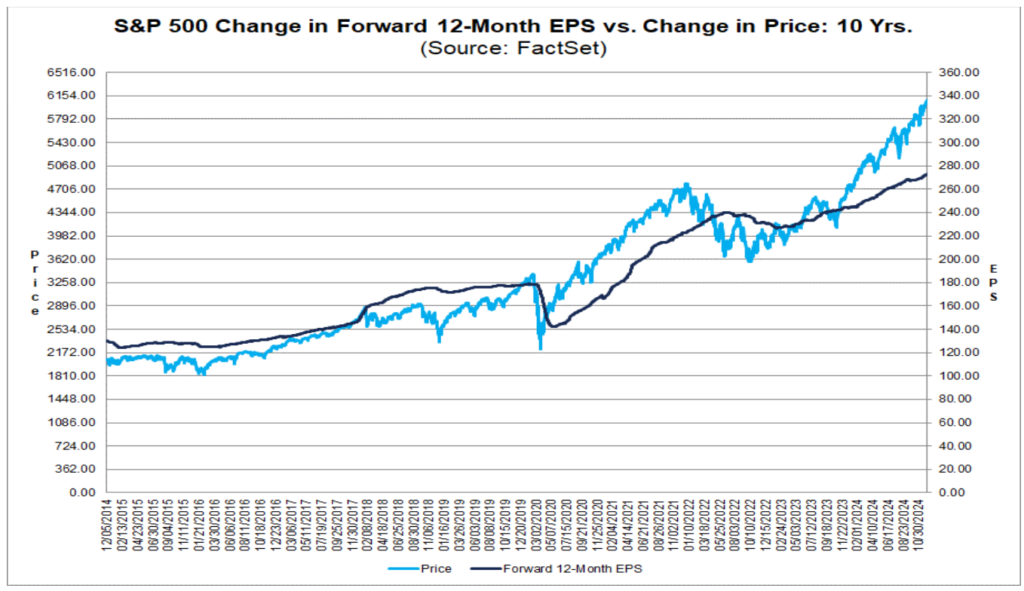
I like the following chart. It shows the change in forward expected 12-months earnings per share (EPS), which is the anticipated amount of earnings of the companies within the S&P 500 Index. It also shows the change in price of the S&P 500 Index over time. When the blue line extends further from the dark blue line, it shows you that price is moving higher faster than earnings are moving higher. This indicates that stock prices (valuations) are getting more elevated relative to the actual earnings growth of the companies.
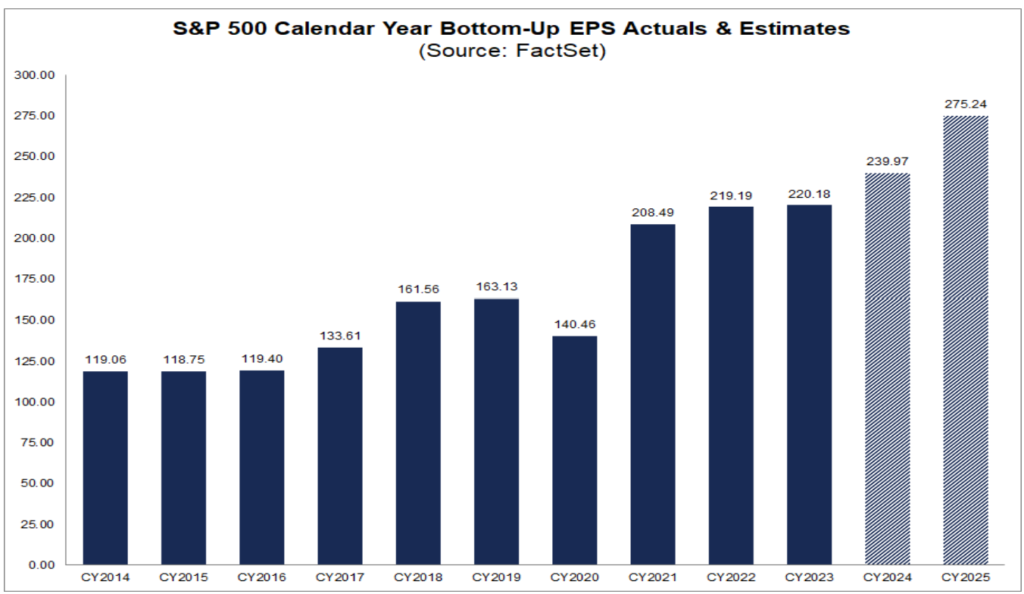
Why are stock prices moving higher? Well, at a minimum, it is anticipated that companies in the S&P 500 are growing their earnings. Per the graph below, the total earnings per share of the aggregate companies in the S&P 500 Index is forecasted to increase from $240 in 2024 up to $275 in 2025. This is an anticipated earnings growth rate for the S&P 500 Index next year of +14.5%. Future earnings estimates often start high then start coming down over the year, so that’s something to be aware of.
Stock prices tend to move in a direction before the actual event or results happen as investors try to predict what will happen. So in the case of higher potential earnings in 2025, you have to ask yourself how much of this is already priced in by the market? If valuations are higher than they were at the beginning of the year, it seems logical that at least some of next year’s earnings growth may be priced in the market already.
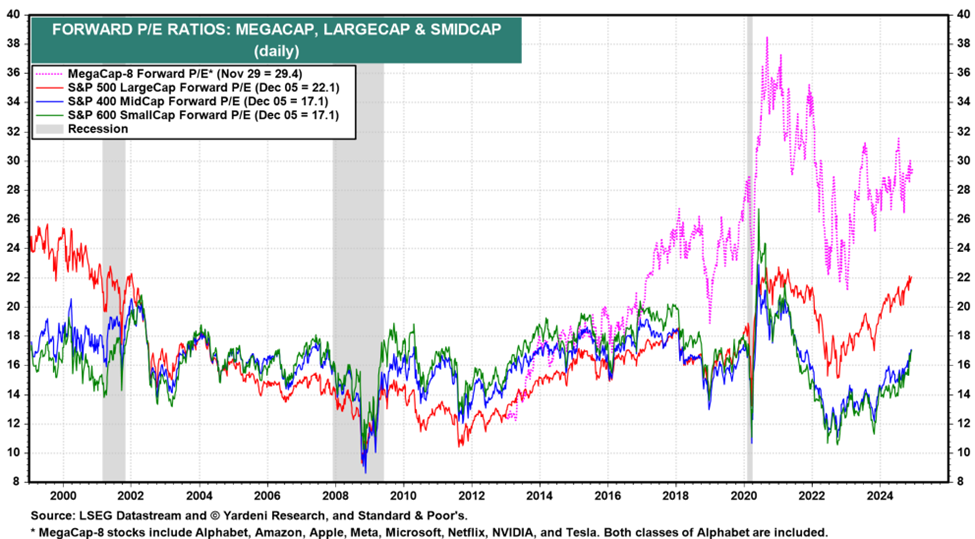
I also like this chart below. It shows the forward P/E ratio (valuation) of the top 8 companies that many are familiar with (Alphabet, Amazon, Apple, Meta, Microsoft, Netflix, NVIDIA, Tesla), relative to the broader large cap S&P 500 Index, as well as mid caps and small caps. As you can see, the top 8 companies and broader large cap index are trading at higher valuations than mid and small caps relative to their own history.
Some of the reasons for the valuation differences is based on anticipated growth rates, general price momentum, perception vs. reality, etc., but it is important to be aware of these valuation differences. While these valuation differences can continue, and valuations over the short term are very tough to tactically time, it at least shows to me that having diversification across market cap could be beneficial.
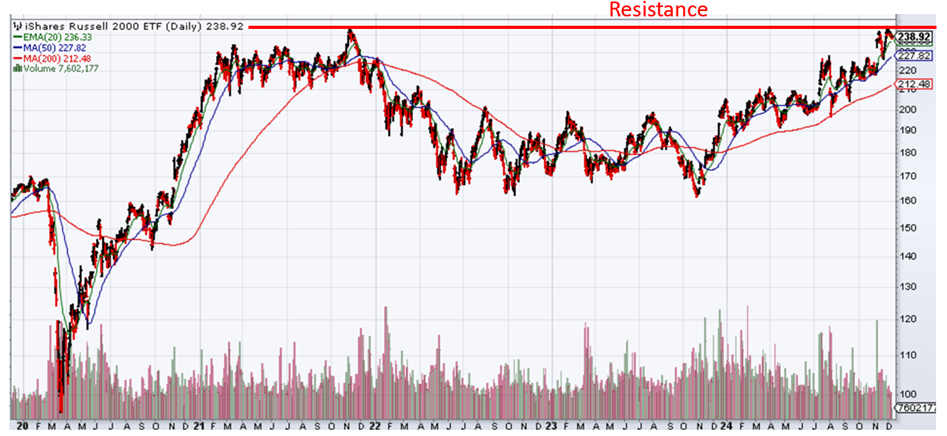
One other thing I’m keeping an eye from a technical perspective is in small caps. The Russell 2000 Index (small caps) has yet to break out sustainably above its previous high, but it’s close. The S&P 50 Index, NASDAQ 100 Index, Dow Jones Industrial Average and Russell Mid Cap Index have all broken out to new highs. If the Russell 2000 Index can break out to new highs as well, you may have technical traders push small caps higher with a bit more “oomph” than they have done in the recent past. Time will tell. You can easily keep an eye on it using a proxy like the iShares Russell 2000 ETF as I show in the chart below.
2025 S&P 500 Index Target
Some people like targets for the S&P 500 Index each year. I have a problem with specific index targets and I don’t envy the strategists that have to do it. See my notes on the various Wall Street Strategist targets and how they move them after the market moves.
- Wall Street Strategists’ Guesses for 2024 January 14, 2024
- Wall Street Strategists’ 2023 Forecast Review – Ouch! January 9, 2024
- Wall Street Strategists’ 2023 Outlook (Guess) January 15, 2023
If you want to get a target for the S&P 500 for next year, you can listen to the Wall Street strategists, which are forced to come up with a target for their job…..aaaannndddd……they then change the target throughout the year as the market moves expecting you to catch up after the move has happened. I can’t stand that. I digress.
Or, instead of or in addition to the Wall Street strategists, you can just take the 2025 estimated $275 earnings forecast for the S&P 500 Index from FactSet shown above, put a 12-month trailing P/E (price-to-earnings) range on it, say 24x on the mid-to-high end and 17x on the low end, and do some calculations. That can give you a range on the S&P 500 Index that you could consider “normal”.
So for me, I’ll take the $275, then reduce it by 10% to get to $247.50 to try to be a little conservative. I’ll use a 17x P/E for the downside (again to be a little conservative) and multiply to get: $247.50 x 17 = 4207 on the S&P 500 Index for a potential downside target. If we use the upper P/E ratio of 24x, then $247.50 x 24 gets you to 5940, which is about right where we are now. That signals to me we could have some sort of pullback next year in the S&P 500 Index and it would be completely normal.
If we want to measure a potential bullish market on the numbers, and EPS is 10% higher than the $275 estimate at $302.50, then using the 17x and 24x P/E multiples, we can get to a range of 5142 and 7260 on the S&P 500 Index, respectively.
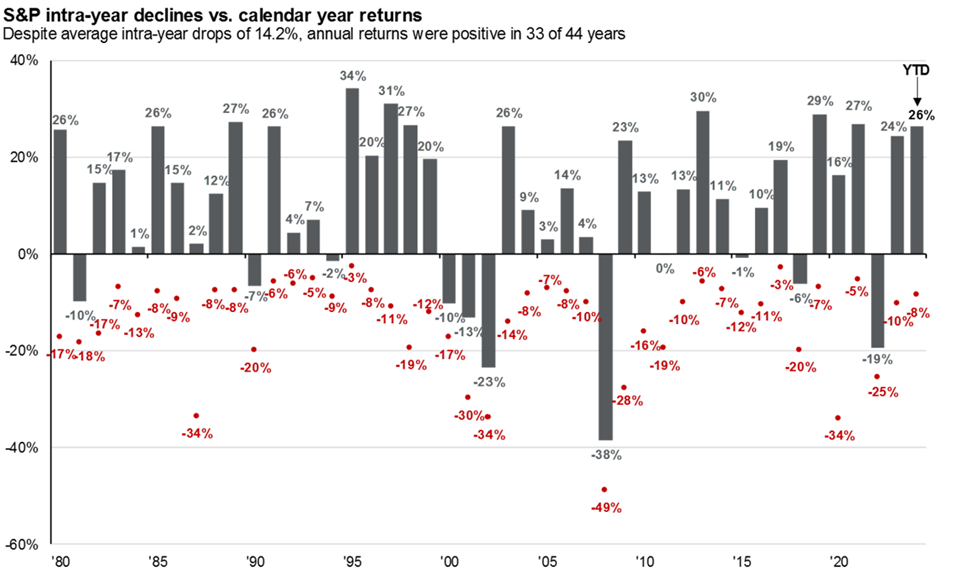
Equity markets generally decline from their highs around 5-15% in any given year, so I’ll just be patient and let the U.S. equity market come to me. If there isn’t any real downside movement in the market, I’ll just hold what I have. I just like to be prepared for whatever the markets throw at me.
You can see the annual declines in the S&P 500 Index each year over time in the chart below. Close your eyes and pick a year. That could be the decline for next year, or any year going forward. No one knows for certain what the world will bring, so you just need to plan to take action whatever the financial markets do, whether you like it or not.
For next year, I’m just anticipating a flat to higher market for the S&P 500, so maybe a 0-10% growth range with volatility that might pop up for some reason throughout the year. Anything materially higher or lower and I might make a material allocation shift.
From my perspective I’ll use that more conservative, lower 4200-ish target (calculated above) on the S&P 500 Index as a level to consider getting materially aggressive in my strategies. A decline from current levels at around 6000 down to 4200 is a 30% decline, so nothing that hasn’t happened before. Any declines less than that, I’ll probably just tactically rebalance and maybe just incrementally increase risk on any pullbacks that are interesting enough in select areas, if they ever come.
In summary, I continue to prefer to be diversified across high-quality growing companies across market cap in the U.S. I’m holding my nose a bit through the higher valuation in larger caps, but I prefer to take a long-term approach and tactically rebalance when appropriate. I do maintain some additional non-core tactical leveraged exposures to U.S. biotech and semiconductors. If U.S. equity markets sell off materially from here, I may consider increasing leveraged exposure in my U.S. Core X and Global Unconstrained strategies.
FOREIGN EQUITIES

I’m still moderately bullish on foreign equities.
When investing internationally, investors will be concerned about tariffs, the U.S. dollar vs. foreign currencies, and the historical underperformance of foreign equities to U.S. equities.
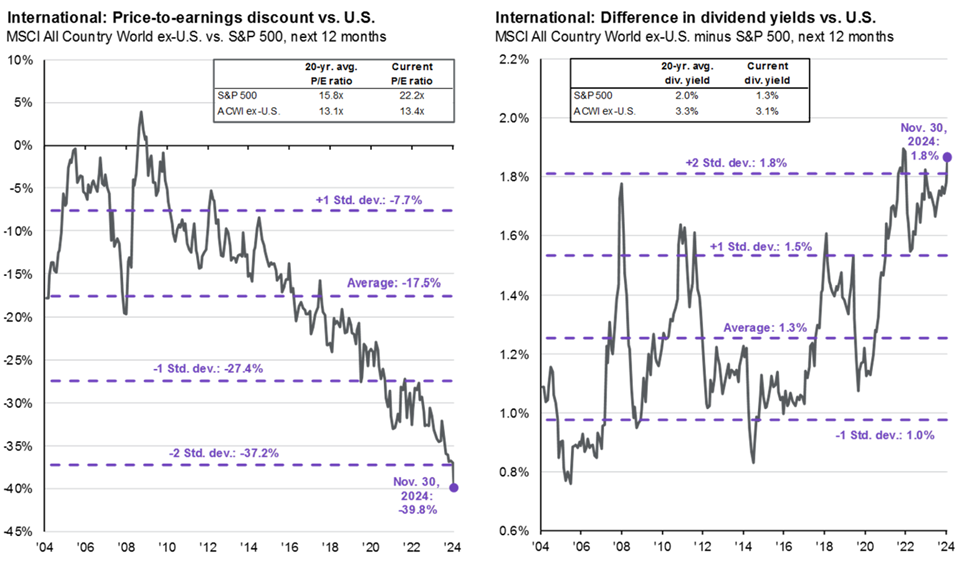
The lack of strong artificial intelligence and other strong technology companies outside of the U.S. makes investing internationally a bit less interesting for many. I totally get it, but I do think there are companies throughout the world that can grow earnings/cash flow at my target 6-10%+. With valuations still at a big discount to U.S. equities, I’m still allocating to international equities to maintain that broader equity diversification.
If U.S. interest rates continue to move higher relative to European and Asian interest rates, and U.S. assets continue to outperform foreign assets, you could see the U.S. dollar continue to rally against foreign currencies. This would put a bit of a short-term headwind on foreign assets held by U.S investors, like myself. I don’t want to try to time currency hedges, and not many investment managers can tactically hedge currency well with any consistency anyway. I actually can’t stand the currency volatility, but it’s an unfortunate part of investing internationally.
From a positioning perspective, just like in the U.S., I like to focus on higher-quality, growing companies with diversification across developed and emerging markets and across market cap. To get this exposure, I like to utilize active managers or specific quantitative strategies to get my exposure to foreign equities. I’m not a fan of just getting market cap-weighted exposure to international equities, or even U.S. equities for that matter.
As previously mentioned, I did reduce my relatively large overweight to leveraged Chinese equities following the big rally from the beginning of the year to early October. I call that a win. I may re-add if Chinese equities get to much lower levels again. I do still have a small allocation dedicated to leveraged Chinese equities and across broader emerging markets that allows me to tactically rebalance and allow Chinese equities to potentially move higher over time.
HIGH INCOME
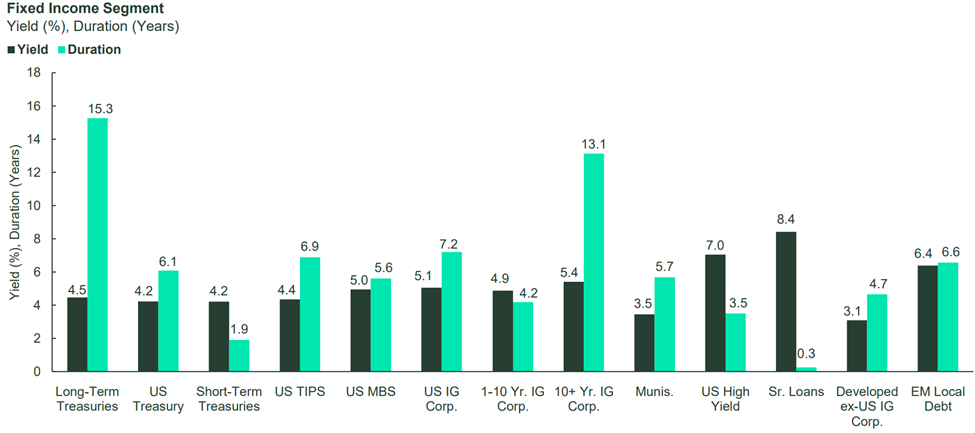
I’m still a fan of higher income-generating assets, and remain moderately bullish on the space. This includes option income, tactical multi-asset high income strategies, diversified closed end funds and higher income-generating credit-sensitive assets. Income yields can reach the 6-8% across these types of strategies, and even higher depending on the strategy.
Depending on the strategy, option income can generate 7-8%+ yields, high yield and emerging market bonds could get you 5-7%+ (although spreads are tight), closed end funds can offer 8%+ (although discounts are tight and less interesting) and investment grade credit strategies with limited duration can get you 4-5%+.
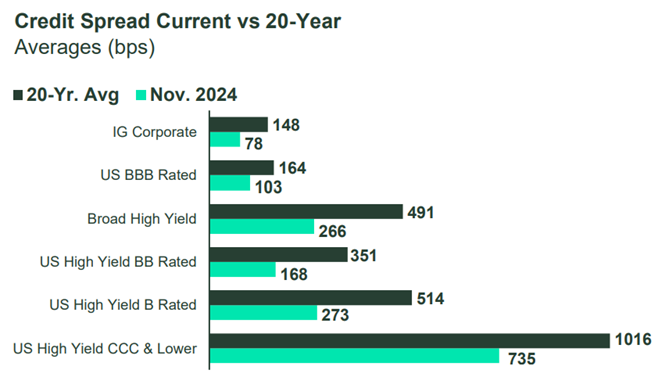
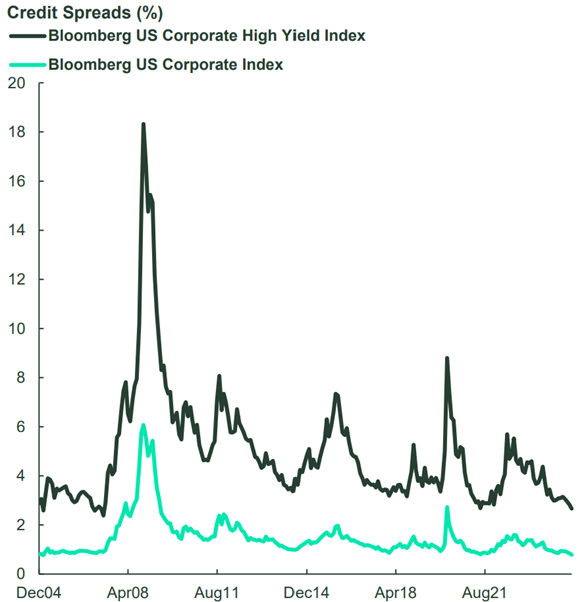
As shown in the graph below, credit spreads are tight relative to history, so while I do want exposure to higher income-generating credit to complement my equity exposure, taking on a ton of credit risk relative to conservative bond assets may not be as attractive. It’s all about how you view credit-sensitive bonds. As I’ve stated in the past, I consider high yield (below investment grade) and emerging market bonds as risk assets, not conservative assets.
I think if next year turns out to be flat or negative, very different than what the strategists are calling for, then these higher income-generating strategies can potentially provide a buffer to the downside or generate income in a flat market. I like having some sort of drier powder to utilize and add to riskier areas (pure equities, leveraged positions), so having these higher income assets make total sense to me.
COMMODITIES
I really don’t have a ton of conviction in a call on commodities.
Overall I would consider myself slightly bullish overall as the global economy continues to grow and the Chinese government appears to want to provide stimulus to their large domestic economy. This could put upward price pressure on economically-sensitive commodities, like copper and other industrial metals.
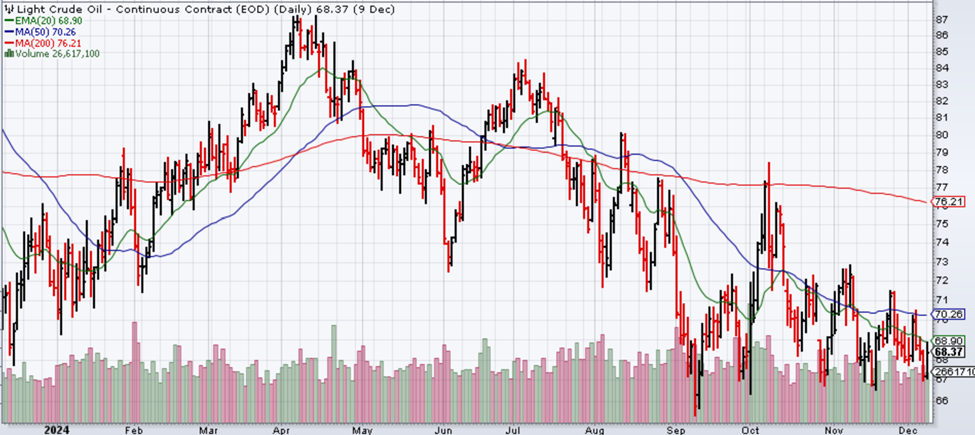
Oil prices will be interesting to watch. If Trump succeeds in his desire to “drill baby drill”, this could increase oil supply, which in isolation could put downward prices on WTI Crude Oil. Remember if supply is greater than demand, prices often fall. WTI Crude Oil generally trades in a $60-$100 per barrel range and as of December 9, 2024, WTI Crude Oil is trading around $68 in what may be a downward price trend. Based on this alone, I’m leaning slightly bearish on WTI Crude Oil at these prices. If WTI Crude Oil drops below that $65-ish technical support level, prices could swiftly move lower, just based on market technicals alone.
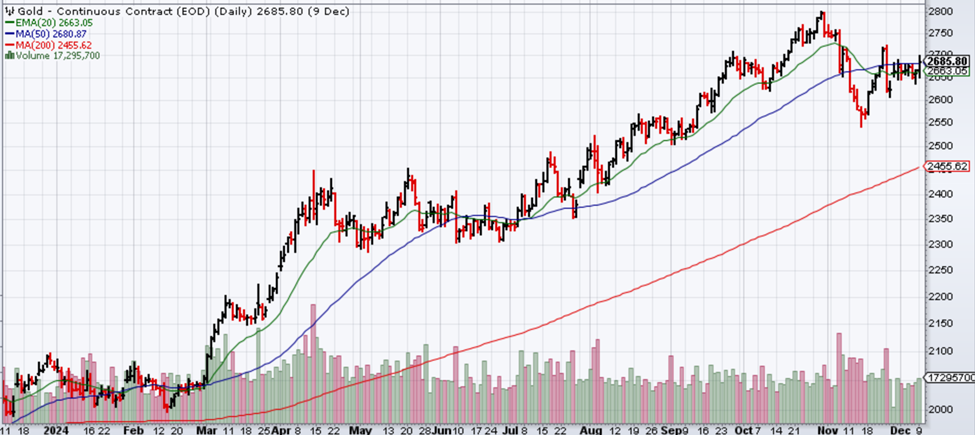
As always, I don’t have a fundamental view on gold for the reasons I’ve discussed in the past that you can read on KulwickiInsights.com. Looks like from a technical perspective in the chart below, gold is consolidating a bit but the longer-term 200-day moving average (red line) is still rising, which could put a floor under gold and/or potentially keep pushing it higher over time.
CONSERVATIVE ASSETS
Interest rates moved slightly higher following the election as investors may be anticipating stickier inflation under a Trump presidency. Inflation could stay a bit higher due to increased tariffs, deportations (less labor supply) or stronger than anticipated economic growth.
If the U.S. budget deficit and higher U.S. debt levels aren’t addressed, long-term interest rates could gravitate higher due to the higher potential long-term credit risk associated with the U.S. This is probably a longer-term concern, but borrowers hoping for longer-term interest rates (i.e. mortgages) to significantly decline might be disappointed.
From a bond investor’s perspective, a quick move to higher bond yields can push bond prices lower, which can be painful for investors in long-duration bonds. Once those higher yields are sustained though, higher interest rates can be a good thing, as higher income is generated and potentially locked in for years.
With interest rates along the yield curve above 4% and spreads on credit adding a little bit more yield to that, the total return on a diversified portfolio of investment grade bonds could be in the 4-6% range. That’s not too bad. Credit spreads are a bit tight, so I’m not heavily bullish on credit at this time.
If rates move higher from here, maybe above 4.5% across the yield curve, and/or credit spreads widen materially, I’d become more bullish at that time.
Right now, my preference continues to be to allocate to active, multi-sector bond managers to provide exposures across bond sectors, duration and credit quality.
U.S. GOVERNMENT BONDS
I’m slightly bullish on U.S. government bonds at these levels, but if yields gravitate above 4.5% on the yield curve, I could become more bullish than I am now.
For conservative investors cautious on credit risk, U.S. Treasuries remain an option to consider. With yields above 4% across the Treasury yield curve and inflation anticipated to be in the 2-3% range, investors could lock in bond yields that help preserve purchasing power over time, which is good. For investors looking for government-related bonds outside of Treasuries with a higher potential total return, agency mortgages could also be something to consider.
U.S. INVESTMENT GRADE CREDIT
In my last Outlook & Positioning commentary back in September, I was moderately bullish on U.S. investment grade credit, but I am shifting to just slightly bullish. Credit spreads have tightened further, which reduces the potential upside relative to U.S. Treasuries.
Both high yield and investment grade credit spreads are close to tights we haven’t seen in a while. No real reason for me to be overly bullish and take a ton of credit risk as part of a conservative asset allocation at this time.
While I generally prefer exposure across investment grade credit-sensitive bonds over U.S. government bonds, with credit spreads where they are now, I’m less bullish than I was a few months ago. If spreads widen a bunch for some reason, I’ll probably become more bullish on credit at that time.
With that said, because the Treasury yield curve is above 4% across the curve, the absolute total return you can get from diversified investment grade credit can be in the 5-6%+ range, depending on the credits you’re allocated to. If you’re on the upper end of that yield range, that could be a nice complement to equities, especially with U.S. equity valuations appearing elevated and equity volatility typically higher than that of intermediate-term investment grade bonds.
For my investment grade credit exposure, I continue to prefer to be allocated to active bond managers that can tactically allocate across investment grade credit-sensitive bonds rather than allocating to a passive bond index.
OTHER
I use this section to talk about other potential strategies, generally whether or not hedges are needed on asset classes.
With U.S. large cap index valuations appearing a bit stretched and credit spreads are tight, it’s hard to be overly bullish on risk assets and some sort of hedge may be appropriate at this time. This is why I remain slightly bullish on “Other” strategies.
I don’t necessarily think you need expensive alternative strategies to reduce equity/credit risk. As a long-term investor, my risk reduction preference is to remain allocated to higher income-generating assets as my “drier powder”. I also reduced my exposure to leveraged positions, so my risk is already reduced. I don’t need assets to not go down, I just need assets that go down less than others in a market selloff.
To reduce risk, other investors or short term-minded investors may want to reduce equities and allocate to bonds. Bond investors may want to reduce exposure to credit-sensitive bonds.
I’ve covered and allocated to various alternative strategies over the years and they can potentially help when there aren’t many other options to consider, like in the low yielding bond environment that we had for years. For those investors comfortable in alternative strategies, some equity hedge, credit hedge or options-based hedges could make sense as well.
With that said, with bond yields in the 4-5%+ range, reducing equity risk by allocating to credit-sensitive bonds makes sense to me rather than an overly complicated alternative strategy that may or may not work out how you want it to.
We’re in a much better bond yielding environment now, so I prefer traditional asset diversification over alternative strategies at this time. For me personally, I just need assets that fall less than equities and still have a positive potential total return over time. A diversified allocation to credit-sensitive bonds and other high income-generating assets does that for me just fine.