
Strong Year for U.S. Equities; Bonds Were Mixed
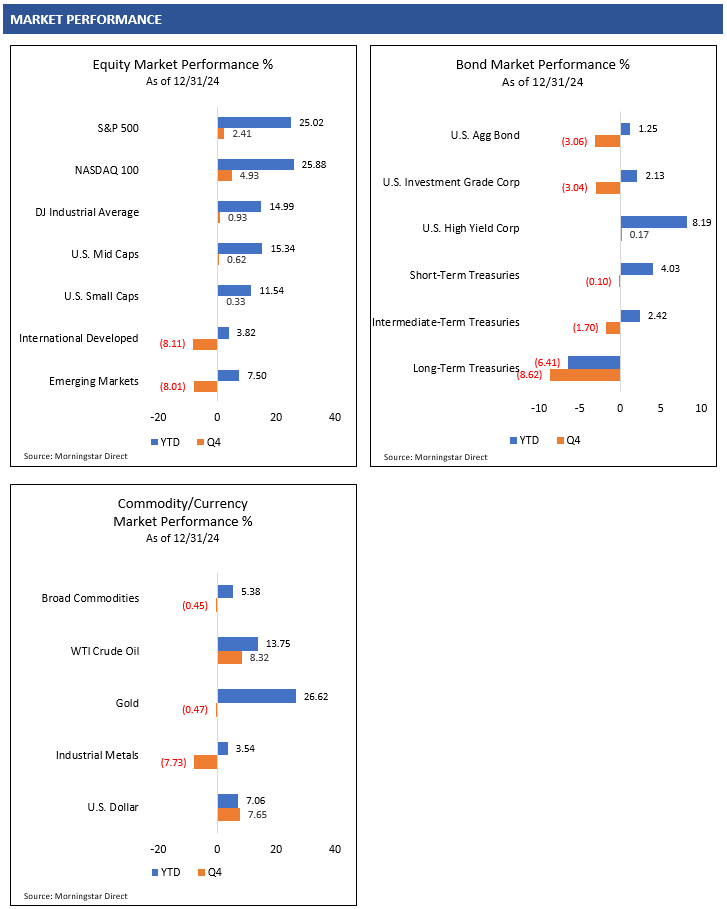
2024 was another strong year for investors in the U.S. equity market. The S&P 500 Index ended the year up 25.0% and the NASDAQ 100 Index was up 25.9%. Smaller U.S. companies lagged large caps in 2024, with the Russell 2000 Index rallying 11.5%.1
The U.S. equity market started the year off very strong, led by investors’ bullishness on artificial intelligence-related companies. Volatility started to pick up mid-summer as U.S. equities experienced a quick selloff in July/August, but eventually rebounded higher. Uncertainty up to the November elections kept investors somewhat cautious, but equity markets rallied shortly thereafter and stabilized into the end of the year.
Bond investors experienced significant volatility this year. The year began with high expectations that the U.S. Federal Reserve would cut interest rates significantly throughout the year based on inflation continuing to decline. Inflation as measured by the Consumer Price Index (CPI) did decline last year and the Federal Reserve did cut the fed funds rate, but inflation was a bit stickier than anticipated.
Unlike investors’ belief that disinflation and declining interest rates would continue through the year, interest rates across intermediate- and longer-term maturities actually moved higher over the course of the year. As interest rates moved higher, bond prices experienced downward price pressure. Fortunately for investors in less interest rate-sensitive and credit-sensitive bonds, income generation provided some return throughout the year.
Uncertainty is a certainty when investing. As we begin 2025, investors will need to navigate elevated equity valuations in the U.S., a potentially slowing economy, global geopolitical risks and patiently wait for the new Republican government leadership to initiate, debate and enact fiscal policies. U.S. corporate earnings are anticipated to be strong and pockets of valuation opportunities in the U.S. and abroad remain. Investors should remain prudent as we move forward.
Elections Are Over but Fiscal Policy Clarity Needed
The November elections are over with Republicans taking control of the White House, House of Representatives and Senate. Investors appeared to celebrate these results with a strong rally in risk assets following the election, anticipating a more favorable business environment under Republican leadership.
Investors will now turn from election rhetoric and promises to actual policy proposals, votes and implementation. It remains uncertain as to which proposed fiscal policies will have enough votes to be passed and implemented as desired by Republican leadership. Taxes, tariffs, immigration and government spending will be some of the key policies investors will be focused on.
Taxes. The 2017 Tax Cuts and Jobs Act, which reduced taxes for companies and individuals, has provisions that are expected to expire at the end of 2025. Under Republican leadership, investors are anticipating some sort of extension of the tax cuts, but the details are unknown. An extension of the tax cuts may be beneficial for individuals and companies, but discussions around higher U.S. debt levels could remain a concern for investors.
Tariffs. President-elect Donald Trump has been calling for expanded tariffs on trade partners. Investors will be monitoring how tariffs could be implemented and how much direct impact they might have on prices and inflation.
Immigration. Immigration was also a key campaign topic for Republicans. Immigration policies can impact labor supply and consumption, so the details of any potential deportation strategy will be important to monitor.
Government Spending. Government spending will also be a focus for the new administration. President-elect Trump proposed a presidential advisory commission called the Department of Government Efficiency (DOGE). DOGE, led by Elon Musk and Vivek Ramaswamy, is tasked with finding opportunities to reduce inefficiency and wasted expenses.
U.S. government spending is approximately 23% of GDP.11 Any material decreases in government spending could flow through to the broader economy and will be something investors will need to keep an eye on. Investors will also be monitoring U.S. deficit spending and the overall debt-to-GDP level. If deficits are not managed effectively and debt levels continue to rise, bond markets may experience higher volatility and rising longer-term interest rates.
Fed Rate Cuts Dependent on Inflation and Unemployment
The Federal Reserve reduced the fed funds rate target 25 basis points (0.25%) to 4.25%-4.50% in December, which is a two-year low. Federal Reserve Chairman Jerome Powell reiterated that the Federal Reserve was not on a preset course and that monetary policy would be managed to try to get inflation down to the Federal Reserve’s 2% target.
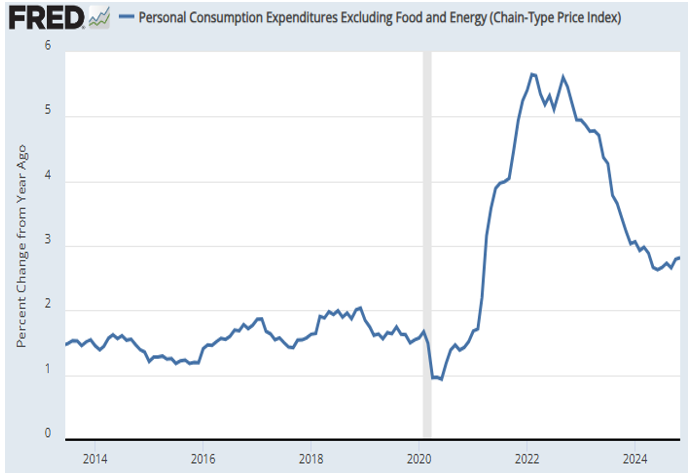
Investors will continue to monitor inflation data to gauge the probability of future Fed rate cuts. The Personal Consumption Expenditures (PCE) Excluding Food and Energy Price Index, a preferred metric used by the Fed to monitor inflation, measured 2.8% for November 2024.2 The PCE index has been moving higher since June, which may be problematic for the Fed and investors if inflation remains elevated.
Personal Consumption Expenditures Excl. Food and Energy
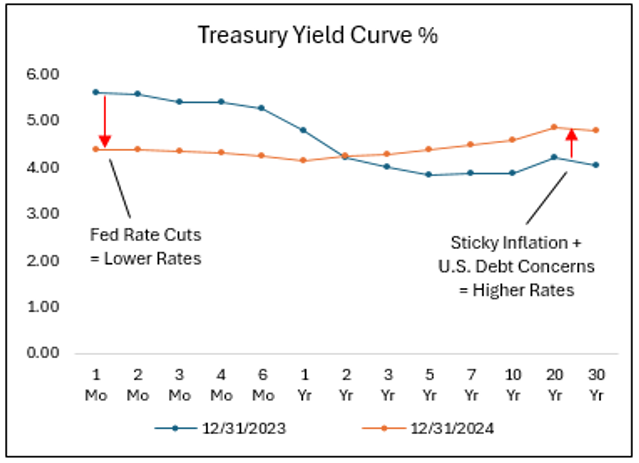
As inflation has picked up again, interest rates across the Treasury yield curve have moved higher. It is important for investors to be aware that even if the Federal Reserve cuts the fed funds rate (an overnight borrowing rate), interest rates on longer-term maturities can move independently of the Fed. The Federal Reserve has a larger influence on short-term interest rates, while bond investors have more influence on longer-term rates based on their opinions on future inflation and long-term debt levels.
The Fed will also be keeping an eye on the second part of its dual mandate: maximum employment. The Fed monitors the unemployment rate with hopes of keeping unemployment low while maintaining a stable inflation rate.
The U.S. unemployment rate in November 2024 was 4.2%4, which remains at the lower end of its historical range. This relatively low unemployment rate provides some indication that companies are still in need of employees and the U.S. economy remains healthy.
With inflation a bit elevated, the unemployment rate relatively low, and economic growth appears stable, the Fed may have less pressure to cut the fed funds rate much further. The Fed has reiterated it will be data dependent, so investors will need to monitor the economic data and any potential impact from new fiscal policies going forward.
Corporate Earnings Forecasted to be Strong in 2025
According to FactSet, analysts forecast that the aggregate earnings of companies in the S&P 500 Index could be $275 in earnings per share in 2025.5 This is forecasted earnings growth of 14% relative to 2024. This anticipated strength in corporate earnings may have been one of the factors behind the U.S. equity rally in 2024.
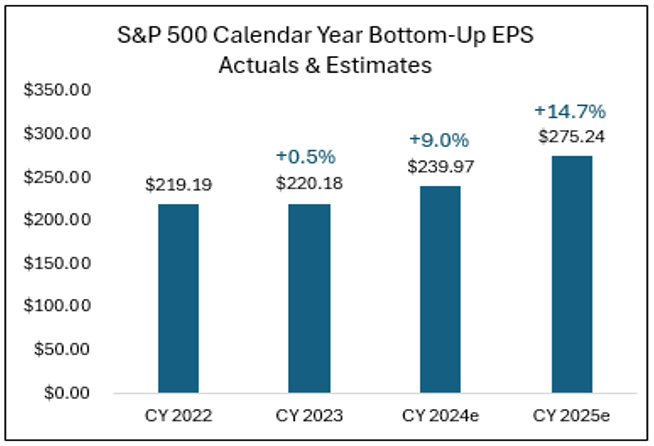
Since investors attempt to position their investments based on anticipated future events, investors will need to determine how much of the equity rally in 2024 was already priced in due to anticipation of earnings strength in 2025. As we get further into 2025, investors will shift their focus to future earnings growth in 2026, and equity markets could adjust accordingly.
Wall Street S&P 500 Index Forecasts for 2025
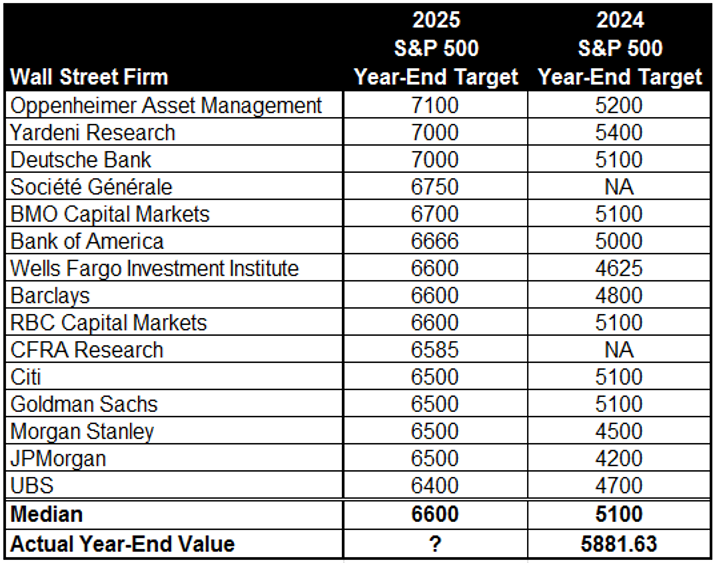
Wall Street strategists have released their 2025 year-end price targets for the S&P 500 Index. The median S&P 500 year-end 2025 price target of 15 Wall Street firms is 6600.6 With the S&P 500 Index ending 2024 at 5881.63, this would indicate price growth of approximately 12%. With earnings estimates for the S&P 500 index anticipating solid growth, a bullish outlook for equities may be substantiated.
Wall Street strategists often change their price targets throughout the year as they update their forecasts, so take the current 2025 forecasts with some caution. For example, we can look at the list of Wall Street strategists’ forecasts for 2024 as of December 11, 2023, and compare them with the actual 2024 year-end value of the S&P 500 Index.
Wall Street 2025/2024 S&P 500 Index Year-End Forecasts
2024 Year-End Target forecasts as of December 11, 2023.7 S&P Global.8
In late 2023, Wall Street strategists forecasted the S&P 500 Index to end 2024 at 5100. With the S&P 500 Index ending 2024 at 5881.638 the strategists’ initial forecasts were a fair bit under the mark. As the index rallied throughout the year, many strategists adjusted their year-end forecasts higher to keep up with the rally. These adjustments are often based on what strategists believe to be changing fundamentals and the market environment.
Investors should be cautious when relying on any one forecast to make decisions. Investors should be cognizant of all relevant factors that may affect investment results and make decisions accordingly.
Q4 Market Review
Equity Markets
U.S. equity markets were volatile in Q4. Equities began the quarter with uncertainty leading up to the November elections but rallied once the Republican Party sweep was confirmed. After the elections, interest rates started to move higher and equity volatility picked up.
As interest rates moved higher throughout the quarter, investors appeared to seek safety in higher-quality growth companies that are less sensitive to higher interest rates. This could have also resulted in a desire to sell areas such as small caps and other cyclical areas of the market that can struggle in a higher interest rate environment.
For the quarter, large cap technology-related companies’ stocks performed relatively well, while smaller, cyclical and higher dividend-paying companies showed weakness. The Russell 3000 (all cap) Growth Index rallied 6.8% in the quarter, while the Russell 3000 Value Index declined 1.9% in Q4.1
International developed and emerging countries’ equity markets were generally weak in Q4. A significant rally in the U.S. dollar relative to foreign currencies appeared to drive a substantial part of that weakness in foreign equities. Economic and political uncertainty continue to plague the European economy, adding to investor caution. China’s government appears inclined to support its economy, but China’s economic data has yet to show signs of material strength.
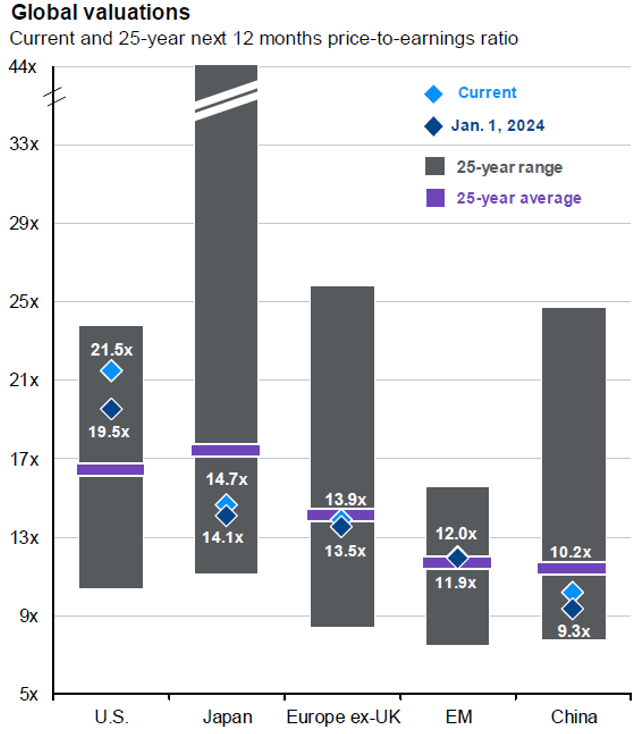
Equity valuations in the U.S. appear to be a bit elevated, while valuations of international companies remain at a significant discount to those in the U.S. Valuations are just one factor investors consider when making investment decisions. Investors may need greater confidence in global geopolitical stability and stronger economic growth outside of the U.S. to want to take advantage of any valuation discounts currently available in international equity markets.
Bond Markets
As anticipated, the U.S. Federal Reserve cut the fed funds rate by 25 basis points (0.25%) in December, but interest rate-sensitive bonds struggled in Q4 as interest rates moved higher due to inflation picking back up again. Investors were reminded that interest rates with intermediate- and longer-term maturities can move independently and sometimes opposite of the Fed’s monetary policy changes.
The U.S. 10-Year Treasury yield jumped to 4.58% at the end of Q4, an increase of 77 basis points from the end of Q3. The 30-Year Treasury yield increased to 4.78% at the end of the quarter, an increase of 64 basis points from the end of Q3.3
As interest rates moved higher, interest rate-sensitive bond prices declined. The Bloomberg Intermediate-Term U.S. Treasury Index declined 1.7%, and the Bloomberg Long-Term U.S. Treasury Index declined 8.6% in the quarter.1
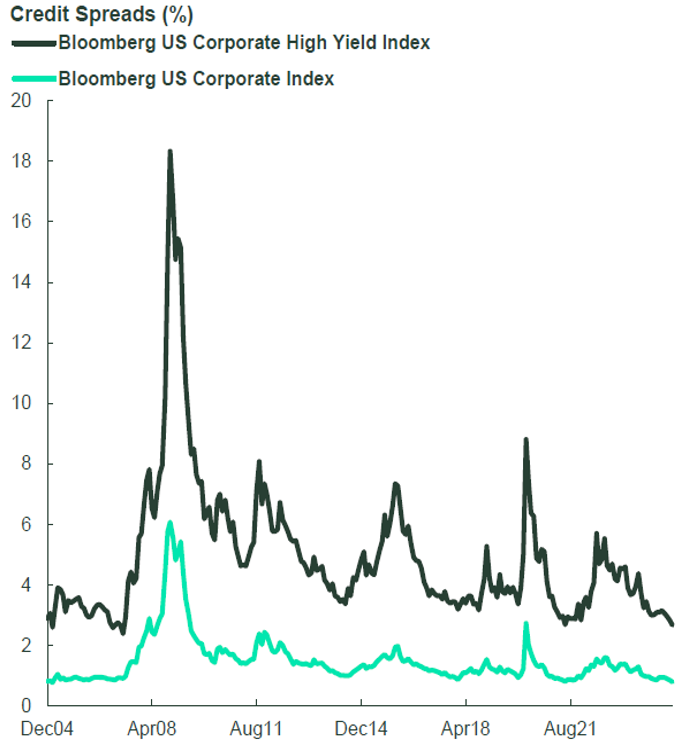
Credit-sensitive bonds generally outperformed in Q4 as their higher income generation and less interest rate-sensitivity helped cushion the downward price pressures from rising interest rates. Credit spreads remain tight, a potential headwind as bond investors receive less additional income for taking on credit risk. Investors anticipate moderate economic growth and strong corporate earnings in 2025, which could continue to provide some comfort for bond investors seeking additional income through credit exposure.
Commodity Markets
Commodity markets were mixed in Q4. Energy markets performed well, while industrial metals and precious metals generally declined in the quarter.
Energy markets saw some strength in the quarter. WTI Crude Oil rallied over 8% in Q4, rebounding from significant weakness experienced in Q3.1 Energy investors will need to continue to navigate geopolitical risks, global economic growth and a potential increase in U.S. oil production as called for by President-elect Trump.
Industrial metals broadly declined in the quarter. This weakness coincided with a risk-off period for cyclical areas of the equity market. Investors may be trying to price in potential weakness for industrial metals and other economically-sensitive assets if interest rates continue to move higher and negatively impact the U.S. economy.
Gold prices were only slightly weaker in Q4, but gold had a very strong 2024, rallying over 26% for the year. Interest rate and currency volatility may continue to impact gold prices throughout 2025.
Currency Markets
The U.S. Dollar Index rallied over 7% in Q41, showing material strength relative to other foreign currencies in the quarter. If global investors believe that new U.S. government leadership could be good for the U.S. business environment while creating challenges for foreign trade partners, it could be supportive of the U.S. dollar. In addition, rising U.S. interest rates relative to other developed market countries could continue to attract investors to U.S. bonds and the dollar.
SOURCES
- Morningstar Direct. Performance provided as total returns. U.S. Mid Caps is defined by the Russell Mid Cap TR USD index. U.S. Small Caps is defined by the Russell 2000 TR USD index. U.S. Growth is defined by the Russell 3000 Growth TR USD index. U.S. Value is defined by the Russell 3000 Value TR USD index. International Developed is defined by the MSCI EAFE NR USD index. Emerging Markets is defined by the MSCI Emerging Markets NR USD index. U.S. Agg Bond is defined by the Bloomberg U.S. Aggregate Bond TR USD index. U.S. Investment Grade Corp is defined by the Bloomberg U.S. Corporate Investment Grade TR USD Index. U.S. High Yield is defined by the Bloomberg High Yield Corporate TR USD index. Broad Commodities is defined by the Bloomberg Commodity TR USD index. WTI Crude Oil is defined by the Bloomberg Sub WTI Crude Oil TR USD Index. Gold is defined by the Bloomberg Sub Gold TR USD Index. Industrial Metals is defined by the Bloomberg Sub Industrial Metals TR USD Index. Short-Term Treasuries defined by the Bloomberg 1-3 Yr U.S. Treasury TR USD index. Intermediate-Term Treasuries defined by the Bloomberg Intermediate U.S. Treasury TR USD Index. Long-Term Treasuries defined by the Bloomberg Long-Term U.S. Treasury TR USD Index.
- U.S. Bureau of Economic Analysis, Personal Consumption Expenditures Excluding Food and Energy (Chain-Type Price Index) [PCEPILFE], retrieved from FRED, Federal Reserve Bank of St. Louis; https://fred.stlouisfed.org/series/PCEPILFE, January 2, 2025.
- U.S. Department of the Treasury. Daily Treasury Par Yield Curve Rates. Retrieved from https://home.treasury.gov/resource-center/data-chart-center/interest-rates/TextView?type=daily_treasury_yield_curve January 2, 2025.
- U.S. Bureau of Labor Statistics, Unemployment Rate [UNRATE], retrieved from FRED, Federal Reserve Bank of St. Louis; https://fred.stlouisfed.org/series/UNRATE, January 2, 2025.
- FactSet. FactSet Earnings Insight. December 20, 2024.
- Marketwatch.com. Could the S&P 500 close at 7,000 by the end of next year? How investors should read rosy 2025 projections. December 19, 2024. Retrieved from https://www.marketwatch.com/story/could-the-s-p-500-close-at-7-000-by-the-end-of-next-year-how-investors-should-read-rosy-2025-projections-e0dcaa54
- MarketWatch.com, “What 2024 S&P 500 forecasts really say about the stock market”, December 11, 2023. Retrieved from https://www.marketwatch.com/story/what-2024-s-p-500-forecasts-really-say-about-the-stock-market-b7609718.
- S&P Global. S&P 500 Index. https://www.spglobal.com/spdji/en/index-family/equity/us-equity/#overview
- JPMorgan. JPMorgan Guide to the Markets. December 31, 2024
- State Street Global Advisors. SPDR® ETF Chart Pack. December 2024.
- Treasury.gov Government Spending and the U.S. Economy (GDP), FY 2015 – 2024 Inflation Adjusted – 2024 Dollar Retrieved from https://fiscaldata.treasury.gov/americas-finance-guide/federal-spending/