
Strong Equity and Bond Market Performance in Q3
Diversified investors were rewarded in Q3 as both equities and bonds rallied in the quarter. Supportive economic data and the anticipation of Fed rate cuts provided tailwinds for the financial markets.
Equities were volatile during the quarter but showed resilience, with performance broadening out by the end of the quarter. The first half of the year was led by performance strength from artificial intelligence and other large cap technology-related stocks. This shifted in Q3 as mid/small caps, cyclicals, international and income-generating assets started to outperform.
Bond markets also showed strength in Q3 as investors positioned for the Federal Reserve to start its federal funds rate-cutting cycle. Interest rates declined across the yield curve and interest rate-sensitive bonds generally outperformed. Credit markets also performed well as yields remained attractive and credit spreads were relatively stable throughout the quarter.
Volatility Spike in August Spooked Investors
For the first half of the year, U.S. equity markets had been on a strong upward trend led by strength in artificial intelligence-related, technology and semiconductor stocks. Volatility was subdued, but markets rarely move upward in a straight line without increased volatility at some point.
In July and August, investors were reminded how quickly market volatility can spike and drive equity markets lower. At the time, investors became very concerned about the potential negative market implications and contagion from the reversal of large investors’ leveraged short positions on the Japanese yen against the U.S. dollar.
History has shown that significant currency disruptions can quickly lead to challenges in other financial markets, and this time was no different. Over a three-week period from mid-July into early August, the S&P 500 Index was down almost 10%, the technology-heavy NASDAQ 100 Index was down approximately 15% and the Philadelphia Semiconductor Index was down over 25%.1
CBOE Volatility Index (VIX)  Source: TradingView.com2 The CBOE Volatility Index measures the expected volatility of the S&P 500 Index over the next 30-day period. |
Longer-term investors who could hold through that short-term volatility have since been rewarded. While July and August were volatile, U.S. equity markets have rallied from the August lows. The S&P 500 Index has already rallied and eclipsed the highs reached prior to the July/August equity market decline.
Highly Anticipated Fed Rate Cut Cycle Begins
The Federal Reserve has a dual mandate of stable prices with annual inflation targeted at 2%, and strong employment. As inflation is anticipated to continue to decelerate, the Fed appears to be more focused on the unemployment rate and maintaining a stable economy. To try to achieve a soft landing in the economy, the Federal Reserve officially started its rate-cutting cycle.
On September 18, 2024, the U.S. Federal Open Market Committee (FOMC) officially reduced the federal funds rate 50 basis points (0.50%) to a target of 4.75%-5.00%.3 This rate cut was largely anticipated, but there was some uncertainty about whether the cut was going to be 25 or 50 basis points. Although this is the first step in the rate-cutting cycle, investors will be increasingly focused on determining what the level of interest rates might be in the future.
The Federal Open Market Committee’s dot plot indicates what members of the FOMC believe an appropriate fed funds rate should be in the coming years and over the longer term. Based on the September projections, FOMC members forecast that the fed funds rate will continue to decline from current levels with a longer-term average rate between 2.5% and 3.0%. The dot plot also shows a wide dispersion of long-term rate forecasts by the members, ranging from 2% to 4%. This indicates the persistent uncertainty in long-term forecasts of the U.S. economy.
FOMC Fed Funds Rate Forecasts (Dot Plot) Source: FOMC Summary of Economic Projections4 |
Interest Rate Volatility Throughout the Cycle
Investors have had to endure significant volatility in the bond markets. Interest rates are heavily driven by inflation and economic growth, and investors have seen significant changes in both over the last five years.
In 2018 and 2019, U.S. real GDP growth was 3.0% and 2.6%, respectively5, and interest rates across the yield curve were relatively stable. Interest rates started to trend lower as the Federal Reserve began to cut the fed funds rate in 2019.
The surprise pandemic from COVID-19 in 2020 shocked the global economy as economic growth and inflation plummeted. The Federal Reserve quickly implemented policies pushing interest rates lower across the yield curve, resulting in a strong rally for bond markets. The U.S. government also implemented fiscal policies to provide additional support for the economy.
As the economy started to reopen after the COVID shutdown, consumers and businesses had significant pent-up demand and began to spend. While demand was very strong, global supply chains were still struggling to fully get back online, which took a couple of years to do so. In addition, the Russia-Ukraine conflict added to supply chain issues across various commodities.
Generally, when demand is greater than supply, prices move higher. With a mismatch of heavy monetary/fiscal stimulus and significant pent-up global demand being unleashed, up against global supply chains that were struggling and not operating at full capacity, inflation spiked quickly throughout the world.
To fight this much higher and persistent inflation, central banks around the world quickly raised interest rates in 2022 and 2023. This rise in interest rates pushed interest rate-sensitive bond prices lower, which was a negative for bond investors.
Now, as economic demand has slowed and the global supply chains have improved, we are in an environment with a tighter match between demand and supply, and global inflation has continued to decelerate. Central banks around the world are cutting interest rates and appear to be on a path toward “normalized” interest rate levels. This shift in interest rates lower has allowed interest rate-sensitive bond prices to rally, benefiting bond investors again.
Although bond investors have experienced significant volatility over the last five years, reflecting on the potential causes of changes in inflation, interest rates and bond prices may provide additional support to navigate other volatile economic environments that may occur in the future.
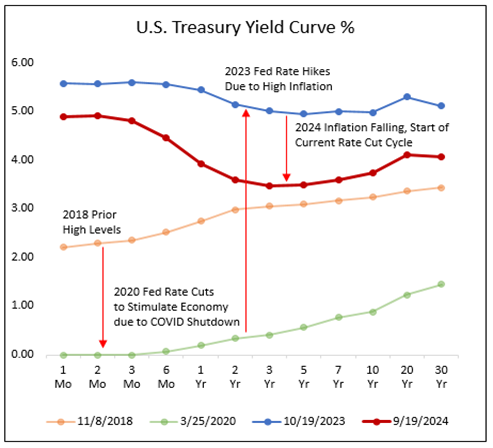 Source: Treasury.gov6 |
Presidential Election Polls Indicate Tight Race
At the end of Q2, it appeared that former President Donald Trump was slightly ahead of President Joe Biden in the presidential election polls. Things changed in July when President Biden announced his withdrawal from the presidential race and endorsed Vice President Kamala Harris as his replacement. Since Vice President Harris accepted the Democratic Party’s nomination for president, the presidential election polls now show a much tighter race between Harris and Trump.
Investors will need to wait until after the November elections to determine who will control the White House and Congress. While the results may not make every U.S. citizen happy or confident in the outcome, it may be prudent for investors to take a longer-term view from an investing perspective.
A simple illustration of long-term investing through different political party leadership is shown in the following graph. The graph shows a hypothetical investment in the S&P 500 Index over time, with an overlay of the political party in presidential power at the time. While historical performance is not a guarantee of future performance, the graph suggests that the U.S. economy and U.S. companies have the potential to be successful over a longer period of time, regardless of the political party in power over a shorter period of time.
 Source: Capital Group7 |
After the election, investors may start to focus on the potential for actual policy implementation. One of the biggest sources of political tension may be on the Tax Cuts and Jobs Act of 2017, which has provisions set to expire at the end of 2025. Investors will be paying attention to any potential changes to the existing tax law and how those changes may impact consumer spending and business profitability.
Global Economic Growth Anticipated to Continue
As investors focus on the U.S. election, it is important to be aware of the strength of the broader global economy as well. Strong economic growth outside of the U.S. can have positive effects on the U.S. economy and the financial markets.
According to the International Monetary Fund’s (IMF) July 2024 World Economic Outlook, the global economy is anticipated to end 2024 with real GDP growth of 3.2% and grow 3.3% in 2025. Regionally, the IMF forecasts the U.S. economy to slow from 2.6% this year to 1.9% growth next year, while Europe is anticipated to see growth increase from 0.9% to 1.5% next year. According to the July report, the IMF forecasts that emerging markets and other developing economies will show the strongest growth in 2025.8
The Chinese government recently announced its plan for large stimulus to support its economy. The Chinese economy is one of the largest economies in the world. If China’s economic growth accelerates, this could provide additional economic support for the rest of the world.
Investors will continue to monitor the strength of the global economy and anticipate any potential impacts across various asset classes. If the global economy can maintain stable growth levels, investors may continue to support risk assets going forward.
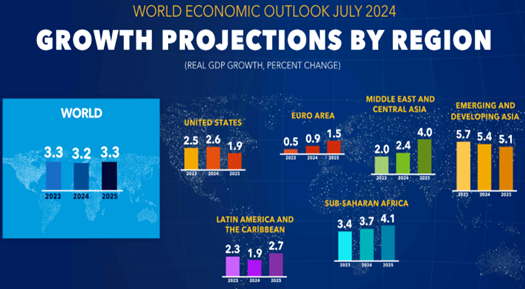 Source: IMF8 |
Q3 Market Review
Equity Markets
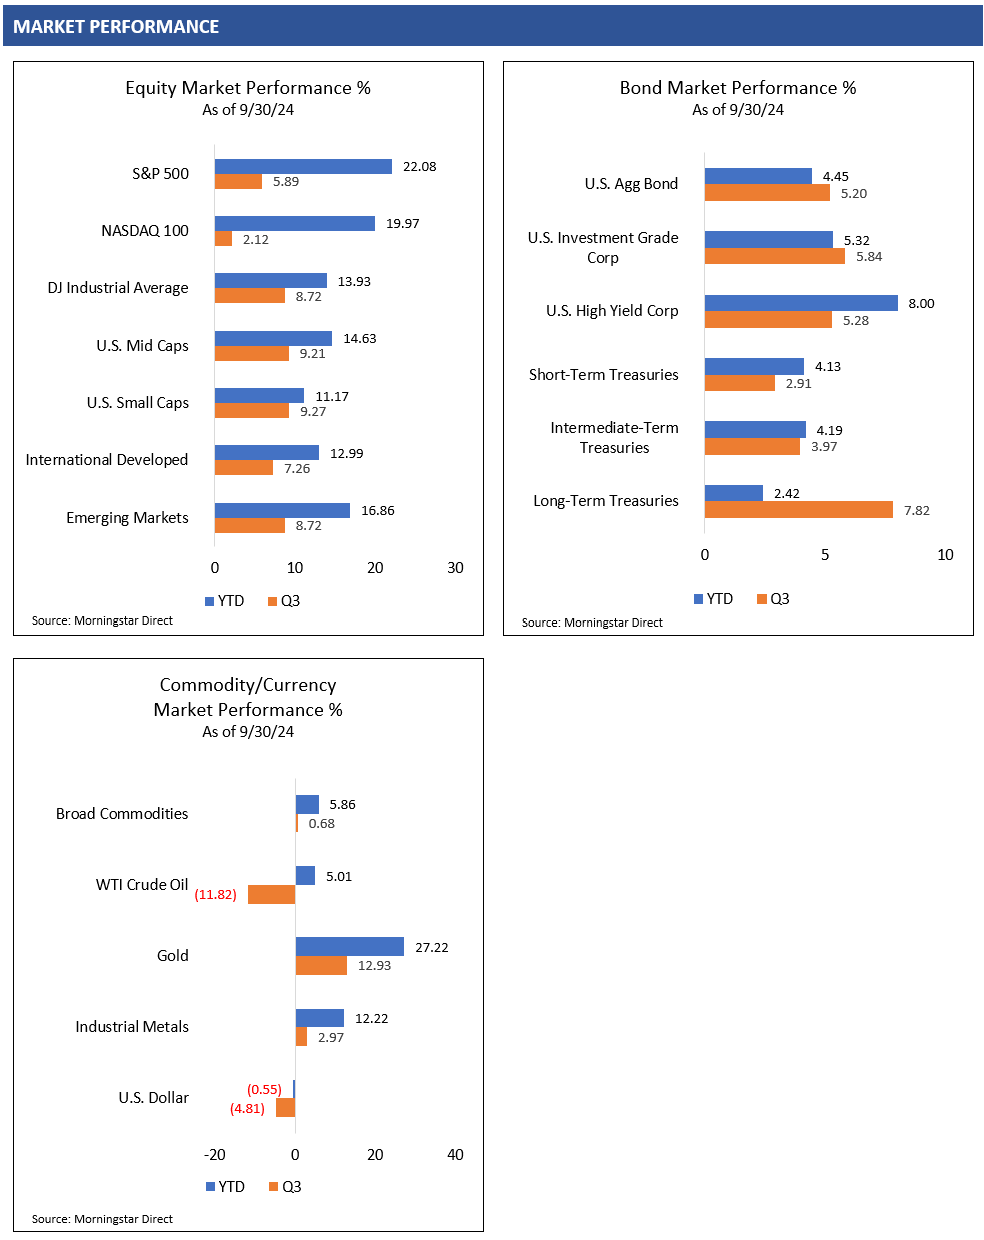
Equity markets rallied in Q3, with a shift in market performance leadership. While the first half of 2024 was driven by the strong performance of artificial intelligence-related and other large cap technology companies, Q3 was led by other areas of the market. Q3 seemed to be an “everything else” rally.
Equity market performance leadership in Q3 included strength across mid and small caps, cyclical companies, international developed markets, China and broader emerging markets. Surprisingly, and potentially tied to declining interest rates, the S&P 500 Utilities sector was the strongest performing sector in Q3, up over 19%. The S&P 500 Technology sector ended relatively flat in the quarter, while the S&P 500 Energy sector was the only negative sector in Q3, down approximately 3%.1
The U.S. economy appears to be resilient, although with some deceleration in growth. Interest rates across the yield curve have already come down to relative lows, providing some relief for longer-term borrowers. The Federal Reserve has officially started to cut interest rates, joining other central banks around the world.
The Chinese government recently announced support for significant stimulus to support its economy. Since China has a large impact on the global economy, China-sensitive regions, companies and commodities across Asia, Europe and the U.S. may be positively impacted by Chinese stimulus. Global investors may start to pay closer attention to the stimulus implementation and its potential impact on various asset classes throughout the world.
With interest rates continuing to decline, global economies remaining relatively stable, and China adding stimulus to its economy, fundamentals may be strong enough for investors to continue to support global equity markets going forward.
Bond Markets
Bond markets rallied in Q3, led by the strong performance of the most interest rate-sensitive, longer-term bonds. It was widely anticipated that the Federal Reserve would cut the fed funds rate, but the magnitude was uncertain. In September, the Fed cut the fed funds rate by 50 basis points (0.50%), with forecasts of more interest rate cuts to come.
Credit-sensitive bonds also performed well in the quarter, as the economy remained stable, and credit spreads remained relatively tight. If interest rates continue to decline, this may provide some relief to companies paying higher interest rates on their debt. This could keep investors supporting the credit markets over the short term.
Commodity Markets
Commodity markets were mixed and volatile in Q3. Gold prices continued to show persistent strength higher, with a declining U.S. dollar providing a potential tailwind throughout the quarter.
Economically-sensitive industrial metals began the quarter relatively weak until early September when industrial metals started to rally and show strength. The Chinese government’s announcement of economic stimulus may have provided additional support to higher prices as investors attempt to anticipate increased demand for industrial metals.
Oil prices trended lower throughout the quarter, with WTI Crude Oil down almost 12% in Q3.1 Saudi Arabia announced it was abandoning its $100/bbl price target and plans to increase oil production in an attempt to strengthen its market share. This may result in downward pressure on oil prices over the short term, but persistent conflicts in the Middle East are always a wildcard.
Currency Markets
Q3 showed a significant reversal of U.S. dollar strength that had been experienced in the first half of the year. The reversal of the “yen carry trade” resulted in a quick selloff in the U.S. dollar and a significant rally in the Japanese yen. This U.S. dollar weakness translated into strength in other European and Asian currencies in Q3, adding a potential tailwind for U.S. investors in foreign assets throughout the quarter.
Sources
- Morningstar Direct. Performance provided as total returns. The S&P 500 Top 50 Total Return (TR) Index is a stock market index comprising the 50 largest companies by market capitalization within the S&P 500 Index. The S&P 500 Equal Weight Total Return (TR) Index is a stock market index where each of the 500 companies in the S&P 500 Index is allocated an equal weight. Index component weightings for the S&P 500 Index defined by the holdings of the SPDR® Portfolio S&P 500 ETF (SPLG). Index component weightings for the NASDAQ Index defined by the holdings of the Invesco NASDAQ 100 ETF (QQQM). U.S. Mid Caps is defined by the Russell Mid Cap TR USD index. U.S. Small Caps is defined by the Russell 2000 TR USD index. U.S. Growth is defined by the Russell 3000 Growth TR USD index. U.S. Value is defined by the Russell 3000 Value TR USD index. International Developed is defined by the MSCI EAFE NR USD index. Emerging Markets is defined by the MSCI Emerging Markets NR USD index. U.S. Agg Bond is defined by the Bloomberg U.S. Aggregate Bond TR USD index. U.S. Investment Grade Corp is defined by the Bloomberg U.S. Corporate Investment Grade TR USD Index. U.S. High Yield is defined by the Bloomberg High Yield Corporate TR USD index. Broad Commodities is defined by the Bloomberg Commodity TR USD index. WTI Crude Oil is defined by the Bloomberg Sub WTI Crude Oil TR USD Index. Gold is defined by the Bloomberg Sub Gold TR USD Index. Industrial Metals is defined by the Bloomberg Sub Industrial Metals TR USD Index. Short-Term Treasuries defined by the Bloomberg 1-3 Yr U.S. Treasury TR USD index. Intermediate-Term Treasuries defined by the Bloomberg Intermediate U.S. Treasury TR USD Index. Long-Term Treasuries defined by the Bloomberg Long-Term U.S. Treasury TR USD Index.
- Tradingview.com Retrieved from https://www.tradingview.com/chart/S5oI8Odc/?symbol=VIX on 9/25/24.
- Federal Reserve FOMC Statement. September 18, 2024.
- FOMC Summary of Economic Projections. September 18, 2024.
- Bureau of Economic Analysis. National Income and Product Accounts. Percent Change from Preceding Period in Real Gross Domestic Product.
- U.S. Department of the Treasury. Daily Treasury Par Yield Curve Rates.
- Capital Group, RIMES, Standard & Poor’s. How elections move markets in 5 charts. Chart shows the growth of a hypothetical $1,000 investment made on March 4, 1933 (the date of Franklin D. Roosevelt’s first inauguration) through June 30, 2024. Dates of party control are based on inauguration dates. Values are based on total returns in USD. Shown on a logarithmic scale. Past results are not predictive of results in future periods. Retrieved from https://www.capitalgroup.com/ria/insights/articles/how-elections-move-markets-in-5.html on 10/2/24.
- International Monetary Fund. World Economic Outlook Update July 2024.