
Mixed Equity Performance, Solid Bond Income Support in Q2
Equity markets were mixed in Q2 as high-quality, large U.S. companies tied to technology and artificial intelligence continued to drive market performance. Other cyclical areas of the market were a bit more challenged.
Bond investors continued to be rewarded with higher yields and income generation. Interest rates moved slightly higher in Q2, putting downward pressure on bond prices, but higher bond income generation offset some of that pressure.
Signs of Economic Deceleration
We are starting to see signs of consumer demand weakening a bit, which should not be a surprise given the strength of the economy in the second half of last year. Hiring appears to be softening, and consumers may be demanding better value and becoming more selective in their purchases. There have been recent indications of pricing discounts on consumer goods, which could start to impact some companies’ profitability.
Recent weaker performance in mid/small caps and cyclical areas of the equity market may be a sign of investors’ increased caution about the economy. This does not mean that a deep economic decline is imminent, but the potential impacts of a deceleration in economic and corporate earnings growth on financial markets should continue to be monitored.
Fed Remains Patient on Rate Cuts
The U.S. Federal Reserve has maintained its interest rate policy, with a federal funds rate target of 5.25%-5.50%. The Fed has indicated that there is a higher probability of rate cuts in the next 6-12 months than there are rate hikes based on the current and anticipated economic environment.
The Federal Reserve has two mandates: maximum employment and price stability. The Fed will monitor several economic data points, but the unemployment rate and the personal consumption expenditures index are two key factors the Fed, economists and investors will constantly monitor.
When we look at the U.S. unemployment rate, the June report registered an unemployment rate of 4.1%. This is higher than the pre-COVID unemployment lows of 3.5% recorded in February 2020, but looking back the last 20 years, a 4% unemployment rate remains at the lower end of the historical range.
The members of the Federal Reserve could believe that a 4% unemployment rate is still close to what they would consider as “maximum employment”. If U.S. workers are near full employment already, even with the fed funds rate target at 5.25-5.50%, the Fed may not feel much near-term pressure to cut interest rates.
When we look at the Personal Consumption Expenditures (PCE) Excluding Food and Energy Index, a preferred data point for the Fed, inflation continues to show deceleration, with a +2.6% 12-month reading in May. While not quite to the 1-2% levels of the last 20 years, the annual increase in prices people pay for things continues to show signs of slowing. With inflation still a bit higher than the Fed’s target, the Fed could remain patient on interest rates until inflation reaches those historically lower levels.
| U.S. Unemployment and Inflation |
 Source: U.S. Bureau of Labor Statistics1; U.S. Bureau of Economic Analysis2 |
Remember, the Fed controls the fed funds rate target, but the rest of the Treasury yield curve is primarily driven by investors in the market. If investors believe inflation will continue to moderate, the economy continues to slow and the unemployment rate continues to move higher, interest rates across the yield curve could move lower independent of and before the Fed takes action to lower the fed funds rate. If interest rates move lower, bond prices have the potential to move higher and bond investors could be rewarded. On the other hand, if inflation reaccelerates or investors become more concerned with elevated U.S. government debt levels, interest rates could move higher, putting downward pressure on bond prices.
Preparing for Upcoming the Presidential Election
Investors will be paying close attention to the upcoming presidential election in November. Following the first presidential debate between President Biden and former President Trump, new polls indicate Trump has a lead over Biden. As the election approaches, investors should be prepared for potentially higher volatility than we have seen so far this year.
Investors tend to prefer business-friendly policies and government spending as they can stimulate the economy and drive asset prices higher. Factors that investors will need to weigh are that the economy is still growing with some inflation pressures, President Trump’s tax cuts remain in place, President Biden’s infrastructure spending has yet to be fully implemented, and the Federal debt continues to make new highs. In this environment, it remains to be seen whether the political parties have broad support for additional economic stimulus.
Investors may also prefer gridlock in Washington. Split-party leadership across the White House and Congress often results in the status quo, where neither political party has full control. If the U.S. economy is still growing modestly, but no major fiscal policy decisions are made, investors can invest with a bit more clarity.
If history is any guide, presidential terms may not have as much impact on the long-term potential of the financial markets relative to other factors. For this reason, long-term investors should be cautious about making significant investment decisions based on political party alone.
Company Concentration in S&P 500 and NASDAQ 100 Indices
Two of the more well-known U.S. large cap equity indices are the S&P 500 and NASDAQ 100. Both indices are allocated to U.S. companies based on select criteria, then weighted by market capitalization (the size of the company). Based on the index construction rules, the S&P 500 Index has broader sector exposure than the NASDAQ 100 Index. Due to the NASDAQ 100 Index having less sector diversification, the index currently has heavier exposure to companies in the technology sector.
Investors may desire investment exposure to these indices as they believe they are investing in a diversified set of U.S. companies. Investors also indicate that the longer-term performance of these two indices has been strong, often outpacing other equity indices across market cap or geography.
While the S&P 500 and NASDAQ 100 indices have performed well over time, as market cap-weighted indices, investors may fail to realize the heavy concentration of a select few very large companies in the indices that helped drive that performance. These companies include Microsoft, Apple, NVIDIA, Amazon.com, Meta Platforms (Facebook) and Alphabet (Google).
These six companies represent approximately 30% of the S&P 500 Index, and approximately 40% of the NASDAQ 100 Index. Broadening out a bit, the top 10 companies weighted in the indices account for over one-third of the S&P 500 Index and over one-half of the NASDAQ 100 Index.
 Source: Morningstar Direct.3 As of 6/30/24. |
 Source: Morningstar Direct.3 As of 6/30/24. |
Another way to look at the impact of company concentration in an index is to look at the performance of the largest companies, the broader index itself, and an equally-weighted index. An equally-weighted index gives each company an equal influence on the index, rather than being weighted by market capitalization. An equally-weighted index can be used to get a sense of the “average” performance of a stock in the index.
Over the last 12 months, there has been a significant uptick in the news around artificial intelligence and the potential breakthroughs that could occur. This has led to certain artificial intelligence-related companies’ stocks rallying significantly, including NVIDIA, Microsoft, Alphabet, Meta
Platforms and Amazon.com. These companies are heavily weighted in the S&P 500 and NASDAQ 100 indices and have been significant contributors to the broader performance of these indices.
If we look at the performance of the top 50 weighted companies in the S&P 500 Index, the broader index itself, and the equally-weighted index in the following chart, we can see that larger companies’ stocks outperformed the “average” company’s stock in the index this year and over the last 12 months. The question for investors now is whether this trend can continue or not.
 Source: Morningstar Direct.3 As of 6/30/24. |
Investors can often get exposure to lower cost, passively-managed index strategies, but it also is important for investors to realize what they are actually exposed to in those indices. In the case of the market cap-weighted S&P 500 and NASDAQ indices, the current heavy concentration of a handful of companies in the indices is a factor that investors should at least be aware of.
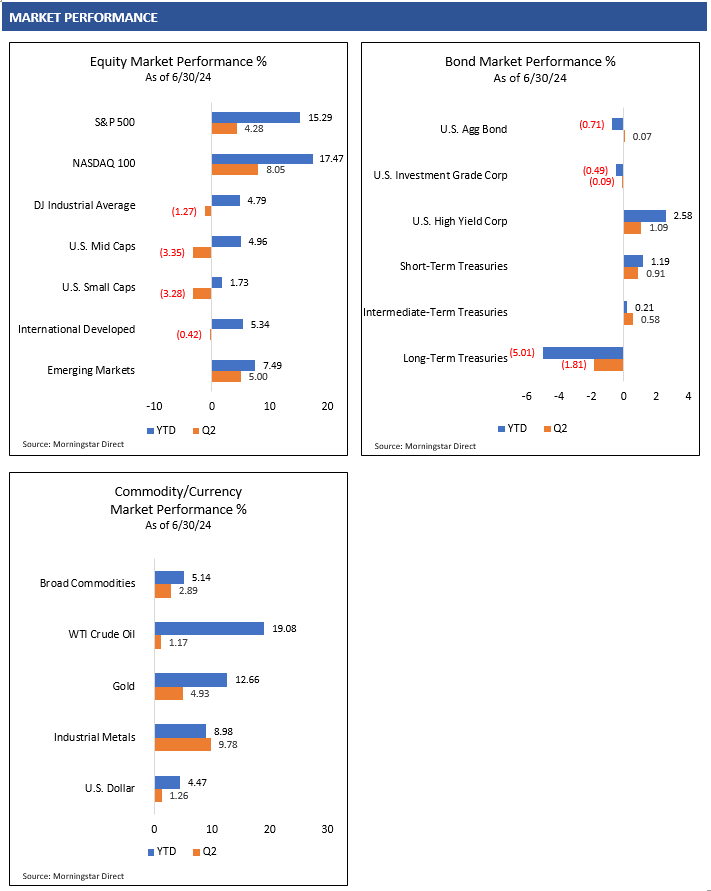
Q2 Market Review
Equity Markets
U.S. equity performance was mixed in Q2. Large, high-quality growth companies tied to technology and artificial intelligence performed very well in the quarter. Other areas such as mid/small caps and more cyclical areas (energy, financials, materials, industrials, real estate) of the market lagged or even declined in the quarter.
Outside of the U.S., performance was also a bit mixed in the quarter. Internationally, there was less of a performance dispersion between growth companies and more cyclical companies as seen in the U.S. Foreign technology companies may not have the technology and artificial intelligence market leadership that U.S. companies do, and foreign stock performance results have indicated as such. Asian markets fared well relative to European markets in Q2 as it appeared China and broader Asia attracted additional capital. Emerging markets outperformed foreign developed markets in the quarter, led by strength in both Asia and Europe, but weakness in Latin America.
Bond Markets
Bond market performance in the quarter was primarily driven by higher bond income due to the persistently higher interest rate environment. This higher yield environment helped offset a volatile quarter for interest rates. Interest rates moved slightly higher across the yield curve in Q2, putting downward price pressure on longer maturity, interest rate-sensitive bonds. This allowed higher yielding short-term bonds to outperform in the quarter.
Credit markets were also relatively stable throughout the quarter. This rewarded investors willing to take on additional credit risk and potential volatility for higher income return. The U.S. economy has shown some signs of slowing, but credit markets have not yet shown signs of significant concern.
Commodity Markets
Commodity markets were volatile in the quarter, but the broader Bloomberg Commodity Index ended higher in Q2. Industrial metals outperformed WTI Crude Oil and gold in the quarter.
WTI Crude Oil prices declined significantly from the start of the quarter through the beginning of June but started to move back higher to end Q2. Investors continue to weigh U.S. and OPEC+ oil supply with potentially weaker demand from China and other parts of the world as economies slow. Gold prices rallied to start the quarter to a new high in May before settling lower, ultimately ending the quarter positive. Economically-sensitive industrial metals were also volatile, with a significant rally to start the quarter through mid-May before quickly declining following softer economic data.
Currency Markets
The U.S. dollar continued to rally in Q2, with significant strength against the Japanese yen. Global investor interest in higher U.S. bond yields, a moderately growing economy and access to U.S. technology leadership could continue to generate demand for U.S. investments and the need for the U.S. dollar. Unless this environment changes, the U.S. dollar could continue to find international support.
SOURCES
- U.S. Bureau of Labor Statistics, Unemployment Rate [UNRATE], retrieved from FRED, Federal Reserve Bank of St. Louis; https://fred.stlouisfed.org/series/UNRATE, July 5, 2024.
- U.S. Bureau of Economic Analysis, Personal Consumption Expenditures Excluding Food and Energy (Chain-Type Price Index) [PCEPILFE], retrieved from FRED, Federal Reserve Bank of St. Louis; https://fred.stlouisfed.org/series/PCEPILFE, July 1, 2024.
- Morningstar Direct. Performance provided as total returns. The S&P 500 Top 50 Total Return (TR) Index is a stock market index comprising the 50 largest companies by market capitalization within the S&P 500 Index. The S&P 500 Equal Weight Total Return (TR) Index is a stock market index where each of the 500 companies in the S&P 500 Index is allocated an equal weight. Index component weightings for the S&P 500 Index defined by the holdings of the SPDR® Portfolio S&P 500 ETF (SPLG). Index component weightings for the NASDAQ Index defined by the holdings of the Invesco NASDAQ 100 ETF (QQQM). U.S. Mid Caps is defined by the Russell Mid Cap TR USD index. U.S. Small Caps is defined by the Russell 2000 TR USD index. U.S. Growth is defined by the Russell 3000 Growth TR USD index. U.S. Value is defined by the Russell 3000 Value TR USD index. International Developed is defined by the MSCI EAFE NR USD index. Emerging Markets is defined by the MSCI Emerging Markets NR USD index. U.S. Agg Bond is defined by the Bloomberg U.S. Aggregate Bond TR USD index. U.S. Investment Grade Corp is defined by the Bloomberg U.S. Corporate Investment Grade TR USD Index. U.S. High Yield is defined by the Bloomberg High Yield Corporate TR USD index. Broad Commodities is defined by the Bloomberg Commodity TR USD index. WTI Crude Oil is defined by the Bloomberg Sub WTI Crude Oil TR USD Index. Gold is defined by the Bloomberg Sub Gold TR USD Index. Industrial Metals is defined by the Bloomberg Sub Industrial Metals TR USD Index. Short-Term Treasuries defined by the Bloomberg 1-3 Yr U.S. Treasury TR USD index. Intermediate-Term Treasuries defined by the Bloomberg Intermediate U.S. Treasury TR USD Index. Long-Term Treasuries defined by the Bloomberg Long-Term U.S. Treasury TR USD Index.