
Global Equity Markets Mixed While Bonds Rally in Q1
Financial markets began the year relatively strong, and investors were bullish following the Republican sweep of the November elections. As President Trump and his administration took office, investors were looking for direction. In a short period of time, the Trump administration quickly announced tariffs, immigration directives, government spending cuts and federal layoffs.
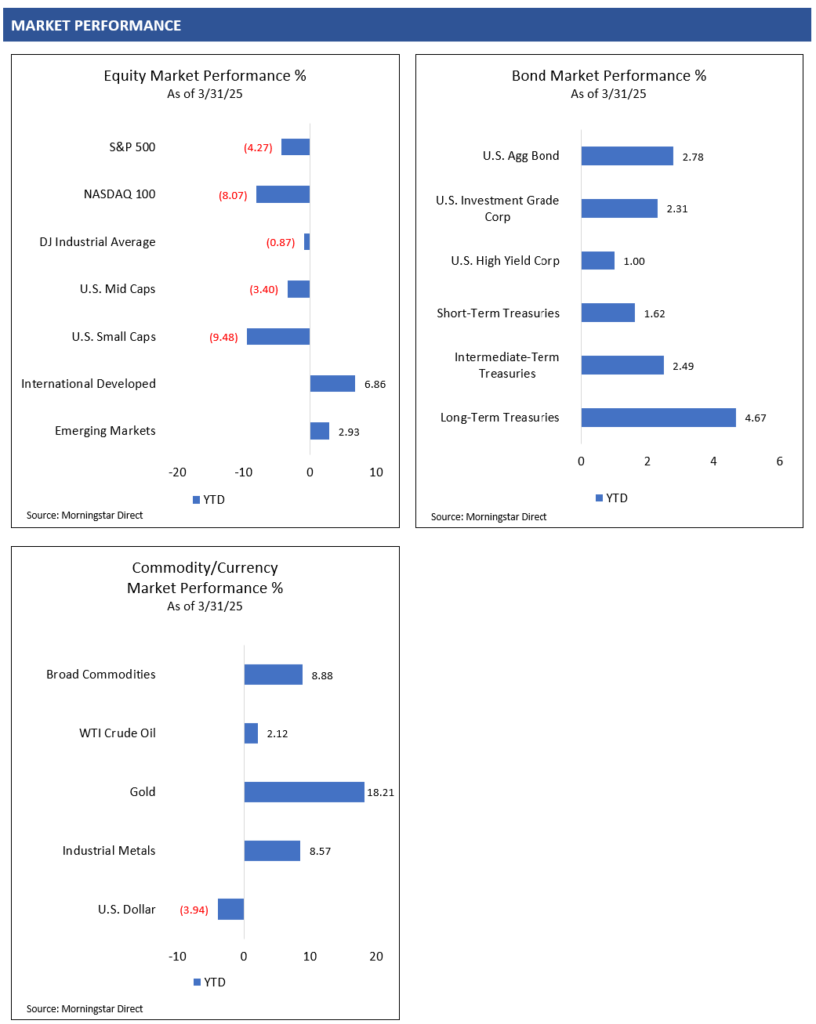
As the Trump administration started enacting its policies, investors appeared to rethink their bullishness. By mid-February, U.S. large caps reached their near-term peak and started to trend lower. To end the quarter, the S&P 500 and NASDAQ 100 Indices declined approximately 4% and 8%, respectively.1
Comparatively, international equity markets performed well in Q1. The MSCI ACWI ex USA Index, consisting of stocks of companies from developed and emerging countries, rallied approximately 5% in the quarter.1 Foreign equity markets were also supported by foreign currencies rallying against a declining U.S. dollar throughout the quarter.
As U.S. risk assets declined, investors sought safety in high-quality bonds, with bonds rallying and interest rates declining. The 10-year U.S. Treasury Bond rallied roughly 4% in the quarter.1
Investors had been increasingly cautious throughout the quarter, waiting for President Trump to announce his administration’s tariff policy. On April 2nd, President Trump announced a new 10% baseline global tariff increase on goods imported to the U.S., with additional tariffs on select countries based on the administration’s calculations. Following the announcement, global equities sharply declined, safe-haven bonds rallied, and the U.S. dollar declined.
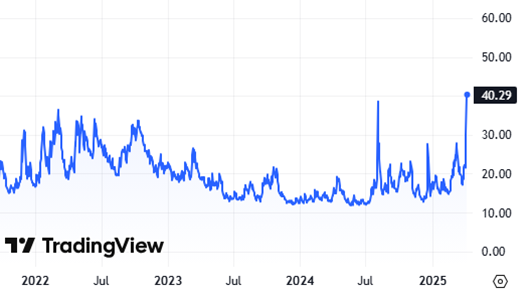
Shortly thereafter, on April 4th, China retaliated with its own 34% tariff increase on imported goods from the U.S. Following China’s announcement, global equities declined further and the VIX, a measure of volatility for the S&P 500 Index, jumped higher. Investors now need to wait to see if any other countries retaliate in a similar manner.
S&P 500 Volatility Index (VIX)
U.S. Fiscal Policy Uncertainty Driving Market Volatility
We stated in our Q4 investment commentary that government policies on tariffs, government spending, taxes and immigration could impact the economy, inflation, corporate earnings and financial markets. President Trump and his administration have been quickly working to implement their policies, but recent sentiment data and weakness in U.S. equity markets indicate elevated cautiousness.
Regardless of one’s political beliefs, businesses, consumers and investors prefer clarity to make decisions. Without clarity, businesses and consumers may hold back on spending and investors may prefer to reduce risk exposure. This is what we may be starting to see in the economy and financial markets this year.
Business, Consumer and Investor Confidence Weakening
Earlier this year, there were signs of potential weakness in business and consumer sentiment as U.S. fiscal policy uncertainty increased. As U.S. equity market volatility increased, investor sentiment also started to show weakness.
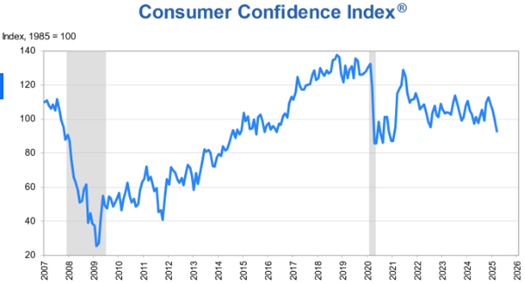
According to the Conference Board’s Consumer Confidence Survey®, consumer confidence has been trending lower following the COVID-19 pandemic recovery in 2021. Short-term consumer sentiment does not necessarily translate into weaker economic data or corporate earnings, but the U.S. economy is heavily consumer driven and weaker sentiment can potentially lead to a slowing economy.
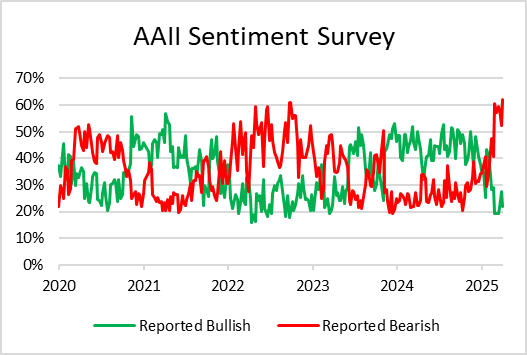
Investors have also appeared to be increasingly cautious. According to the recent American Association of Individual Investors (AAII) weekly sentiment survey, investors have become increasingly bearish on their views of the stock market over the next six months.
With President Trump’s tariff plan announced, and China’s quick retaliation, businesses, consumers and investors will need to see what happens next. It will take time to determine whether President Trump can successfully translate his administration’s policies to a stronger U.S. economy.
U.S. businesses and consumers have shown resiliency in uncertain times throughout history, but clarity and confidence are needed. Investors will need to determine whether the U.S. can remain resilient, or if this time is different. If the U.S. can remain resilient, longer-term investors may start considering taking advantage of opportunities during any shorter-term dislocations in the financial markets.
Economists and Equity Analysts Anticipate a Slowdown
With potential strain on businesses and consumers throughout the world due to trade uncertainty and higher prices from tariffs, economists appear to be reducing their economic growth estimates. Until U.S. fiscal policy is firmly established, economic uncertainty remains and forecasting the economy over the short-term may be difficult.
Equity analysts and market strategists were generally bullish to start the year, but we are starting to see U.S. company earnings estimates coming down. We often see earnings estimates begin optimistically higher, then come down over time, so this is not a surprise, but the magnitude of reductions will be important. With President Trump’s tariff increases higher than what it appears many may have anticipated, corporate earnings estimates may continue to decline.
We have just entered the Q1 earnings reporting season. It will be important for investors to understand company management teams’ forward guidance as to how President Trump’s fiscal policies (tariffs, taxes, immigration, spending) may impact companies’ revenues, costs and profit margins.
Fed Rate Cuts on Pause for Now
The U.S. Federal Reserve maintained the fed funds rate target range of 4.25-4.50% at both of its January and March meetings. The Fed has consistently stated that it will continue to monitor the economy, with its focus on maintaining price stability (moderate inflation) and full employment.
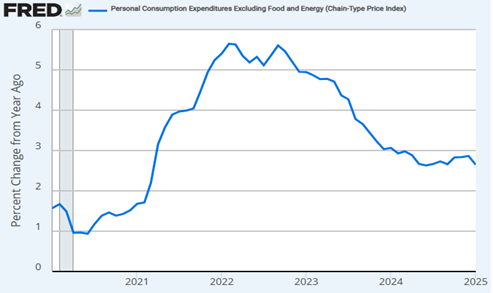
Thus far, inflation, as measured by the Personal Consumption Expenditures (PCE) Excluding Food and Energy Index, has remained between 2.5% and 3% over the last 12 months. At these sustained levels of annual inflation, the Fed does not appear to be eager to cut interest rates. We may need to see inflation get closer to 2% on a sustainable basis for the Fed to cut the fed funds rate further. Higher global tariffs may keep upward pressure on inflation over the near term and the Fed will need to navigate accordingly.
Personal Consumption Expenditures Excl. Food and Energy
From an unemployment rate perspective, the economy remains well below the levels of strain we have experienced in the past. Although the U.S. government has enacted layoffs, we may need to see the private sector reduce its labor force to see the unemployment rate move much higher from here.
U.S. Employment Rate
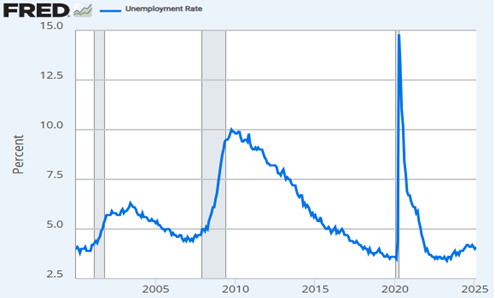
The potential implications of a shift in global tariff policy are a significant wildcard for the Fed to manage through. If the U.S. economy starts to show signs of weakness, the Fed may need to act and cut the fed funds rate to help support the economy.
Q1 Market Review
Equity Markets
The U.S. equity markets were mixed in Q1, with growth companies’ stocks and other higher volatility stocks underperforming more defensive and higher dividend-paying stocks. Investors diversified across company types and sectors benefited relative to those that were aggressively positioned in U.S. growth and speculative stocks to start the year.
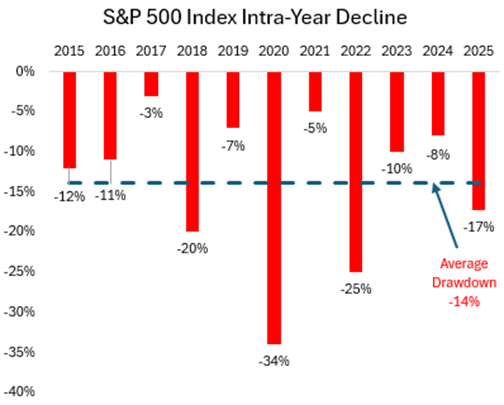
U.S. equities experienced a quick decline from their highs over the course of a few months. From their relative market peaks through April 4, 2025, after President Trump’s tariff announcement and China’s retaliation, the S&P 500 Index declined 17%, the NASDAQ 100 Index declined 21% and the more volatile Russell 2000 Small Cap Index declined 25%.1
The average calendar year decline of the S&P 500 Index over the last ten years has been 14%, with three periods of 20% declines or more. With a 17% decline for the S&P 500 from its peak, the current decline is deeper than average, but within the other three 20% drawdowns over the last decade.
It is extremely difficult to accurately predict and position for a specific drawdown in any given year. At a minimum, investors should consider setting their expectations that an equity market drawdown of 10-15% in any given year is possible, and plan accordingly.
With political uncertainty elevated and the potential impacts from changing global tariff policies unknown, U.S. equity investors will need to determine at what point valuations and longer-term opportunities become attractive enough to start positioning for equity markets to rally.
Foreign developed and emerging market equities performed well in Q1. The MSCI EAFE Index (foreign developed countries’ stocks) rallied approximately 7% and the MSCI Emerging Markets Index rallied roughly 3% in the quarter.1 Potential Chinese government economic support and increased nationalistic support in Europe may have helped drive equity outperformance relative to the U.S. in Q1. A decline in the U.S. dollar relative to foreign currencies was an added tailwind for international equities’ performance in the quarter. If global tariff and trade policy uncertainty results in a global economic slowdown, international equity markets may start to feel increased downside pressure.
Bond Markets
Bond markets rallied in Q1 as investors sought safety in bonds as the U.S. equity market declined. As bonds rallied, yields across the Treasury yield curve declined. The most interest rate-sensitive intermediate-term and longer-term bonds outperformed shorter-term bonds in the quarter.
Riskier, credit-sensitive bonds also performed relatively well in Q1. Higher yields in credit-sensitive bonds helped offset some downward price pressures as credit spreads widened a bit in the quarter.
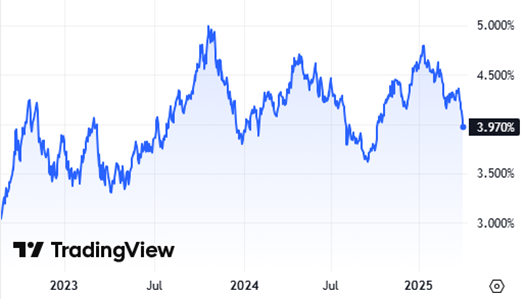
Interest rates have been very volatile over the past few years as uncertainties around economic growth, inflation, U.S. debt levels and government policies persist. Intermediate- and longer-term interest rates have remained in a wide range, and we have yet to see materially higher or lower rates outside of that range.
Looking at the 10-Year U.S. Treasury yield over the last few years, it has remained between 3.5% and 5%. Following the rally in bonds, the yield is trading just below 4% as of April 4, 2025. Investors will need to determine if the yield can continue within that range or if significant changes in economic growth, inflation and U.S. debt levels drive the yield materially higher or lower than that range.
U.S. 10-Year Treasury Yield
The Federal Reserve continues to reiterate it is data dependent and will be patiently monitoring economic data. New U.S. tariff policy and recent federal job cuts have the potential to impact inflation and the employment rate. The Fed will need to be patient to see if economic data worsens, and act accordingly.
The current fed funds rate target range is 4.25%-4.50%. According to the CME FedWatch Tool, financial markets are now pricing in the potential for a 100 basis points (1.00%) cut in the fed funds rate by the end of the year.8 It appears that financial markets may be pricing in a sharper economic slowdown, and that the Fed may need to be more aggressive in cutting interest rates. Fed funds futures have been very volatile the last few years. Investors will need to consider the potential of false signals from the fed funds futures market and focus close attention on the signals from the Federal Reserve directly.
Commodity Markets
Commodity markets broadly rallied in Q1, but drivers of performance appeared a bit mixed. Tariff uncertainty may have put upside pressure on economically-sensitive commodity prices driven by a rush to buy commodities before any potential tariffs were implemented. A declining U.S. dollar may have also provided some additional support for commodities in the quarter.
Gold prices rallied over 18% in Q1. This may have been partially driven by the declining U.S. dollar, a decline in U.S. equity markets and political uncertainty surrounding tariffs and their impact on future inflation.
Industrial commodities also rallied in the quarter. The potential for government economic support in China and Europe may have added to bullishness in industrial commodities for the quarter.
Energy prices were higher in the quarter, driven by strength in natural gas contracts. WTI Crude Oil was slightly higher in the quarter and has remained volatile, driven by geopolitical concerns and supply/demand cross-currents.
Economically-sensitive commodities could be heavily impacted by a global slowdown. If the global economy slows, recent commodity price gains may be short-lived.
Currency Markets
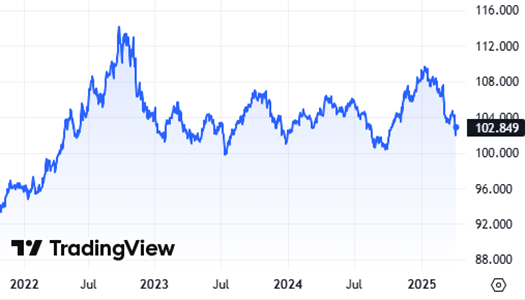
The U.S. dollar sharply declined in Q1 after a strong rally to end 2024. The U.S. dollar is often tied to the attractiveness of the level of interest rates and other U.S. assets relative to the rest of the world. As interest rates and U.S. equities declined in Q1, the U.S. dollar also declined.
Investors will need to determine whether the U.S. economy can resume the strength it has demonstrated compared to the rest of the world over the last few years. The resulting outcome may then drive the path of the U.S. dollar.
U.S. Dollar Index
SOURCES
- Morningstar Direct. Performance provided as total returns. U.S. Mid Caps is defined by the Russell Mid Cap TR USD index. U.S. Small Caps is defined by the Russell 2000 TR USD index. U.S. Growth is defined by the Russell 3000 Growth TR USD index. U.S. Value is defined by the Russell 3000 Value TR USD index. International Developed is defined by the MSCI EAFE NR USD index. Emerging Markets is defined by the MSCI Emerging Markets NR USD index. U.S. Agg Bond is defined by the Bloomberg U.S. Aggregate Bond TR USD index. U.S. Investment Grade Corp is defined by the Bloomberg U.S. Corporate Investment Grade TR USD Index. U.S. High Yield is defined by the Bloomberg High Yield Corporate TR USD index. Broad Commodities is defined by the Bloomberg Commodity TR USD index. WTI Crude Oil is defined by the Bloomberg Sub WTI Crude Oil TR USD Index. Gold is defined by the Bloomberg Sub Gold TR USD Index. Industrial Metals is defined by the Bloomberg Sub Industrial Metals TR USD Index. Short-Term Treasuries defined by the Bloomberg 1-3 Yr U.S. Treasury TR USD index. Intermediate-Term Treasuries defined by the Bloomberg Intermediate U.S. Treasury TR USD Index. Long-Term Treasuries defined by the Bloomberg Long-Term U.S. Treasury TR USD Index.
- TradingView. Volatility S&P 500 Index. Retrieved from https://www.tradingview.com/chart/S5oI8Odc/?symbol=TVC%3AVIX, April 4, 2025.
- The Conference Board. U.S. Consumer Confidence Survey®. https://www.conference-board.org/topics/consumer-confidence. March 25, 2025.
- American Association of Individual Investors. Sentiment Survey Historical Data. https://www.aaii.com/sentimentsurvey/sent_results. April 3, 2025
- U.S. Bureau of Economic Analysis, Personal Consumption Expenditures Excluding Food and Energy (Chain-Type Price Index) [PCEPILFE], retrieved from FRED, Federal Reserve Bank of St. Louis; https://fred.stlouisfed.org/series/PCEPILFE, April 3, 2025.
- U.S. Bureau of Labor Statistics, Unemployment Rate [UNRATE], retrieved from FRED, Federal Reserve Bank of St. Louis; https://fred.stlouisfed.org/series/UNRATE, April 3, 2025.
- TradingVIew.com. U.S. 10-Year Treasury Yield. Retrieved from https://www.tradingview.com/chart/S5oI8Odc/?symbol=TVC%3AVIX. April 4, 2025.
- CME FedWatch Tool. Retrieved from https://www.cmegroup.com/markets/interest-rates/cme-fedwatch-tool.html. April 4, 2025.
- TradingView.com. U.S. Dollar Index. Retrieved from https://www.tradingview.com/chart/S5oI8Odc/?symbol=TVC%3AVIX. April 4, 2025.