
Solid Economic Data Helps Drive Risk Assets Higher in Q1
Equity and credit markets rallied in Q1 as strong economic data and solid corporate earnings provided investors with cover to continue to support risk assets. Last year economists and investors believed that higher interest rates could push the U.S. economy into a potential recession, but that has not materialized.
According to the U.S. Bureau of Economic Analysis, U.S. real GDP measured +3.4% annualized in Q4 2023, following a strong Q3 real GDP of 4.9%. The U.S. economy is relatively diverse and heavily driven by the U.S. consumer. It can be difficult for a strong economy to turn on a dime and materially weaken without a major external event, therefore economists forecast positive economic growth to continue in 2024.
U.S. Real GDP
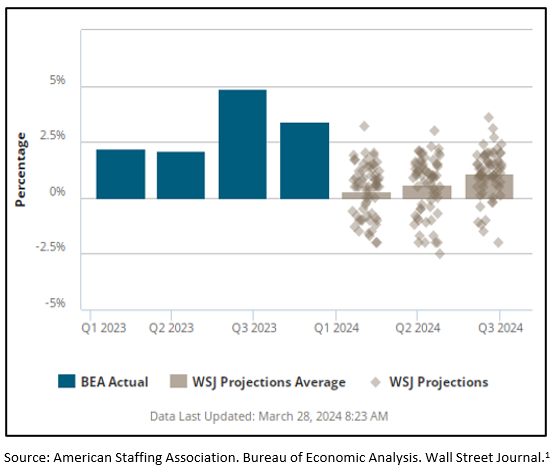
According to the Wall Street Journal Economic Forecasting Survey, economists anticipate deceleration in real GDP growth but not a recession this year. According to the Survey, economists are forecasting U.S. real GDP growth this year of +0.3% in Q1, +0.06% in Q2 and +1.1% in Q4.
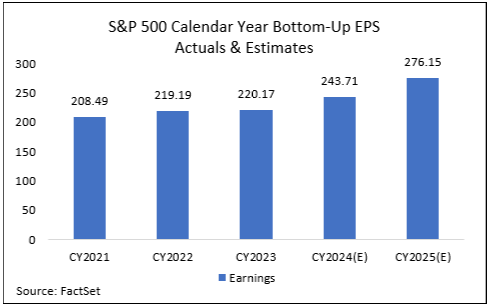
This persistent economic strength may help translate to higher corporate earnings as well. According to FactSet2, analyst bottom-up earnings per share estimates for the S&P 500 Index is forecast to be approximately $243 per share for full year 2024, a roughly 10% increase from 2023, and $276 earnings per share for full year 2025. If longer-term investors anticipate continued earnings growth, that could keep a floor under U.S. equities and allow for further potential upside.
Inflation Remains Persistent
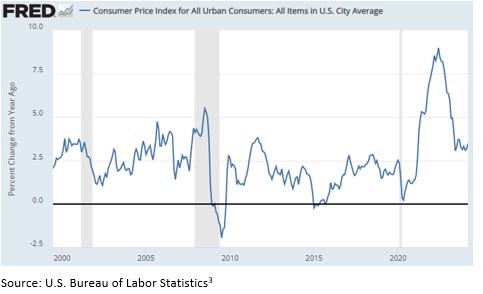
Investors had hoped for inflation to steadily decline from its elevated highs in 2022. We have seen a sharp drop from those highs, but inflation, as measured by the Consumer Price Index (CPI), remains stuck above 3%, with the latest March reading of 3.5%.
Looking back the last 20+ years, annualized CPI above 3% is at the upper end of a historical range but has historically trended lower from those levels. Investors will need to determine whether something has fundamentally changed to keep annual inflation above 3% for the foreseeable future, or if we gravitate back to the lower historical range.
Consumer Price Index (CPI)
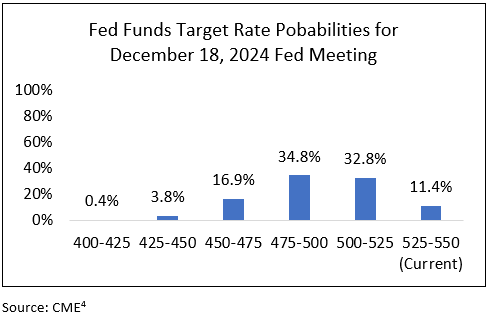
The U.S. Federal Reserve attempts to cool inflation with higher interest rates. The Fed has set the fed funds rate target rate at 5.50%-5.25%, which has helped, but inflation is not yet to the 2% target the Fed appears to be targeting.
Although inflation remains above the Fed’s target, markets continue to price in lower interest rates by the end of the year. According to the CME Fed Watch Tool4, which provides the market’s view of future fed funds rate targets, the market is pricing in a greater than 80% probability that the Fed will cut rates by at least 25 basis points (0.25%) before the end of the year.
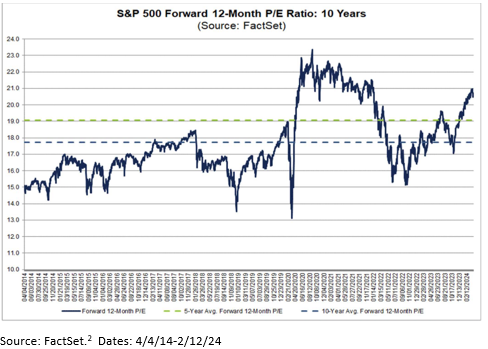
U.S. Equity Valuations Have Stretched Higher
Following the U.S. equity market rally over the last six months, valuations appear a bit elevated, particularly in U.S. large caps (i.e. S&P 500 Index). Markets trading at elevated valuations are not a great short-term market timing tool, but investors should be aware of the environment.
If inflation persists at higher levels, interest rates move higher and/or the economy and corporate profits experience material weakness, financial markets could experience higher volatility and valuations may need to correct lower.
Q1 Market Review
Equity Markets
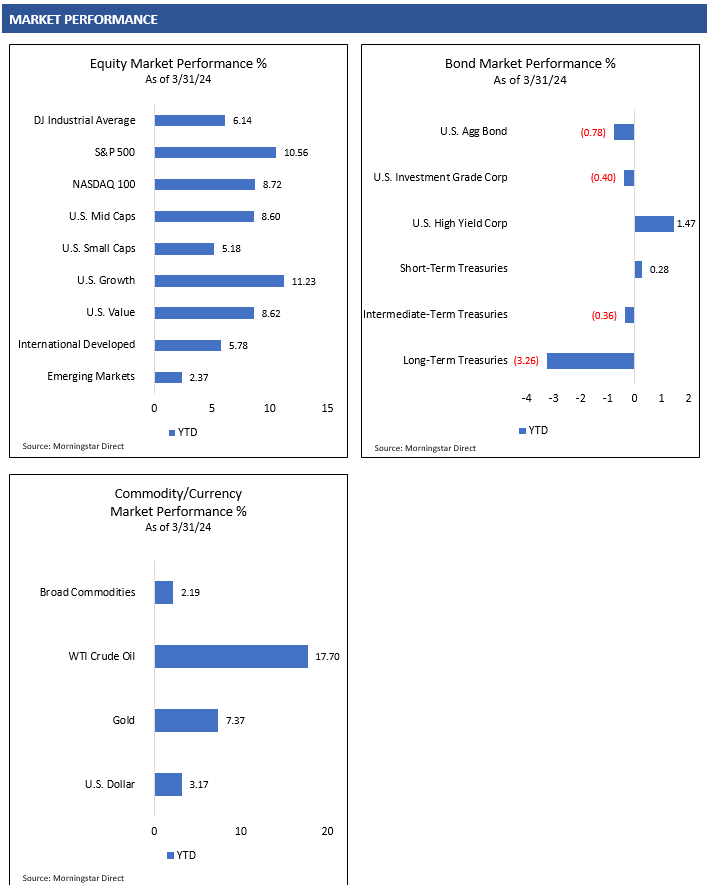
Global equity markets rallied in Q1, initially driven by strength in U.S. technology/artificial intelligence-related companies. As the quarter progressed, investors appeared to shift some focus to areas that had lagged, particularly to more cyclical areas including energy and materials sectors. A strong U.S. economy may at least partially cause investors to add economically-sensitive assets to their portfolios.
Outside of the U.S., international developed and emerging market equities also saw initial strength in technology-related and other high quality growth companies. European and Asian developed market equities performed well on a local currency basis, but a stronger U.S. dollar relative to foreign developed market currencies was a headwind.
Emerging markets were mixed in Q1 as India remained a bright spot for investors, but China continued to experience weakness. China’s lack of a sustainable recovery out of the COVID pandemic, along with geopolitical tensions and the Chinese government’s inconsistent support of its economy and public companies, appear to have kept investors from aggressively supporting Chinese equity markets.
Like the U.S., China’s economy is intricately linked to the strength of the global economy. It will be important to watch how the Chinese economy progresses from here. There are some signs the Chinese economy may be turning around, and Chinese equity valuations appear relatively attractive, but it remains to be seen whether investors are willing to take on added risks to support the Chinese equity market.
Bond Markets
Bond markets were mixed in Q1. Credit markets joined the broader equity market rally as investors preferred riskier assets throughout the quarter. Positive investor sentiment driven by a solid economy and growing corporate earnings continued to attract investors to credit-sensitive bonds. Credit spreads appear relatively tight at these levels and caution may be warranted.
Inflation failed to materially decline in the quarter and appears to be stagnating at CPI levels above 3%. Interest rates moved higher in Q1. The 10-year U.S. Treasury yield is now back above 4.5%5 and it appears investors continue to reduce their forecasts for the number of Fed rate cuts this year. This put upward pressure on interest rates across the Treasury yield curve and pushed interest rate-sensitive bond prices lower.
Commodity Markets
Commodity markets experienced stronger investor support throughout the quarter. Energy prices jumped in Q1, with WTI Crude Oil prices up over 17% for the quarter.6 A strong U.S. economy, a potential broader pickup in the global economy and continued geopolitical tensions in the Middle East and Russia could be reasons for the recent strength in energy.
Gold prices also rallied strongly in the quarter. Market technicals may have been a strong contributor to the performance as the price of gold pushed above its long-term resistance level. It is often difficult to forecast the price of a commodity that does not natively generate cash flows, so technical analysis can often be used to attempt to determine price trends. Gold’s breakout from a long-term trading range may have been the catalyst needed for a strong move higher in Q1.
Currency Markets
The U.S. dollar rallied in Q1 against a broad basket of foreign developed market currencies. The strength of the U.S. economy and higher interest rates relative to developed Europe and Asia may have provided support to the dollar in Q1.
Investors may need to see some signs of reacceleration of economic growth in Europe and Asia to gather support for their currency markets. Until then, U.S. economic strength and higher interest rates may continue to attract investors to the U.S. dollar.
SOURCES
- American Staffing Association. GDP Quarterly. Retrieved from https://americanstaffing.net/research/asa-data-dashboard/gdp-quarterly-projections/ on April 9, 2024.
- FactSet. Earnings Insight. April 5, 2024.
- U.S. Bureau of Labor Statistics, Consumer Price Index for All Urban Consumers: All Items in U.S. City Average [CPIAUCSL], retrieved from FRED, Federal Reserve Bank of St. Louis; https://fred.stlouisfed.org/series/CPIAUCSL, April 10, 2024.
- CME Group, Inc. CME FedWatch Tool. Retrieved from cmegroup.com/markets/interest-rates/cme-fedwatch-tool.html on April 10, 2024
- U.S. Department of the Treasury. Daily Treasury Par Yield Curve Rates. Retrieved from https://www.treasury.gov/resource-center/data-chart-center/interest-rates/Pages/TextView.aspx?data=yield on April 10, 2024.
- Morningstar Direct. Performance provided as total returns. U.S. Mid Caps is defined by the Russell Mid Cap TR USD index. U.S. Small Caps is defined by the Russell 2000 TR USD index. U.S. Growth is defined by the Russell 3000 Growth TR USD index. U.S. Value is defined by the Russell 3000 Value TR USD index. International Developed is defined by the MSCI EAFE NR USD index. Emerging Markets is defined by the MSCI Emerging Markets NR USD index. U.S. Agg Bond is defined by the Bloomberg U.S. Aggregate Bond TR USD index. U.S. Investment Grade Corp is defined by the Bloomberg U.S. Corporate Investment Grade TR USD Index. U.S. High Yield is defined by the Bloomberg High Yield Corporate TR USD index. Broad Commodities is defined by the Bloomberg Commodity TR USD index. WTI Crude Oil is defined by the Bloomberg Sub WTI Crude Oil TR USD Index. Gold defined by the Bloomberg Sub Gold TR USD Index. Short-Term Treasuries defined by the Bloomberg 1-3 Yr U.S. Treasury TR USD index. Intermediate-Term Treasuries defined by the Bloomberg Intermediate U.S. Treasury TR USD Index. Long-Term Treasuries defined by the Bloomberg Long-Term U.S. Treasury TR USD Index.