
Just a quick part 2 to the previous post about how the market could rally, now significantly decline.
Remember, markets don’t always move based on long-term fundamentals. Sometimes it’s just based on news events or market technicals. The 3% sell off in the U.S. equity markets may have been driven by both.
The Federal Reserve Chairman Jerome Powell had a press conference to reiterate the Fed’s desire to bring down inflation with whatever it takes (i.e. more rate hikes). That didn’t help the markets that day. Remember, there are literally computer programs that will buy/sell investments based on news announcements, including what members of the U.S. Federal Reserve say.
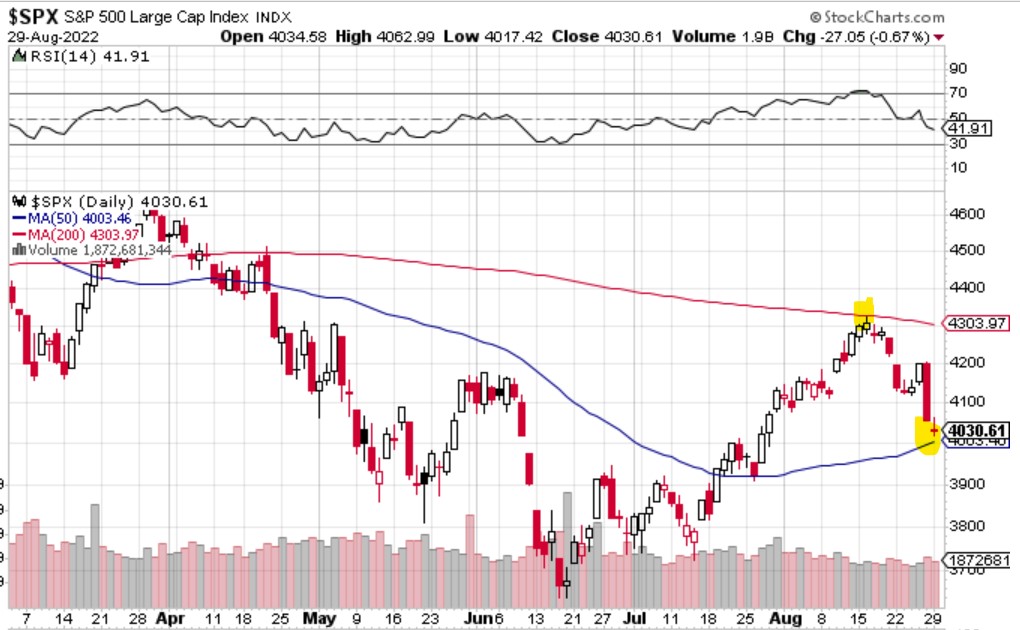
Market technicals can also be a key driver of market movements. In our last post about how the market could rally, we talked about the S&P 500 rallying above the 50-day moving average. If you look at the chart, the 50-day was the blue line and the 200-day moving average is the red line above, which is a line of resistance. Well, the S&P 500 rallied right up to the 200-day moving average(red line) and persistently declined from there. Yes, the entire S&P 500 index can hit red and blue squiggly lines (moving averages) and reverse course when it does.
Although the most recent reversal looks like a perfect example of how great technical analysis is and you could profit by trading these squiggly lines, this doesn’t always work perfectly and you can lose money each time it doesn’t line up perfectly like the last few weeks did. Check out our course on technical analysis for better insights into the pros and cons of these types of strategies.
Just remember that daily moves in the financial markets aren’t always gloomy or optimistic. It could just be computer algorithms and traders trading market technicals. Now the market is getting close to the blue line (the 50-day moving average). You can watch to see what it does from there.