
Here Comes the Vol(-atility), Doo-Doo-Doo-Doo.
Here Comes the Vol, and I say, it’s alright.
A simple Beatles tune, but like the sun, volatility can rise up after being down for a while. But unlike the sun, the timing and frequency of volatility rising and falling are not consistently predictable.
As you may have noticed, volatility in the financial markets has picked up. Tech-heavy equities have sold off quickly, while interest rate-sensitive bonds have rallied. Broad equity indices (S&P 500, NASDAQ, DJIA) can easily decline 5-10% in any given year, even if the indices are up for the full year. The S&P 500 has declined just over 6% from its recent peak and the tech-heavy NASDAQ 100 is down over 11% from its peak.
Deeper declines of 15%+ in broad equity indices can happen after a period of strong exuberance or when economic/corporate fundamentals deteriorate quickly. You don’t have to fear these declines, just be prepared for them and try not to make emotional decisions when they happen.
Just remember, equity markets aren’t some mystical things that rich people talk about or where you see red and green numbers on T.V. with talking heads talking about them. They are a collection of companies with management teams trying to make money. Day to day, minute by minute, millisecond by millisecond movements in stock prices can be just noise relative to what those management teams are doing for those companies over longer periods of time.
VIX Jumps Higher
As we look at the VIX (S&P 500 volatility index), we saw it spike last week, up to around 30 on the index, then pulled back. We hadn’t hit those levels since 2023 and it’s following a period of subdued volatility. Spikes in volatility should be considered a normal part of investing in financial markets.
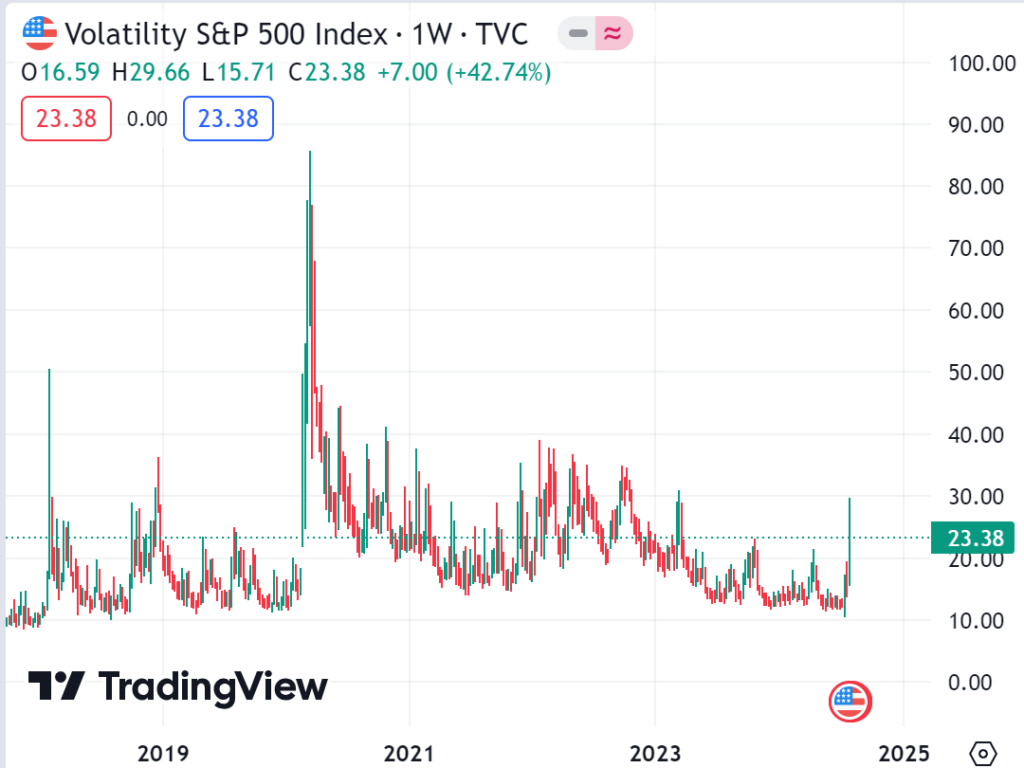
Source: TradingView.com 8/4/24
Why the Spike in Volatility Now?
A number of potential reasons may have finally triggered some heightened volatility in the markets, but nothing we haven’t already discussed as potential drivers of volatility.
- Subdued Volatility: A long period of complacency can bring a quick shift in market sentiment and force quick selloffs. It had been over a year that the VIX got close to the 30-level, which can easily happen in a given year. I guess now is the time for that 30-level to be hit again.
- Economic Data Softening: The recent jobs report indicated continued slowing in hiring and the unemployment rate moved up to 4.3%, showing a persistent rise in the unemployment rate, but it’s still on the lower range of historical unemployment. Investors are concerned that the economy will continue to slow, the Fed might be behind the curve in cutting interest rates and the economy moves into a recessionary phase. Investors have been anticipating a recession for a while but it has yet to materialize.
- Market Technicals Shifting: Some market technicals weakened in the mega cap growth stocks and those tied to the artificial intelligence hype. Semiconductor stocks (Nvidia, Intel, etc.) were quickly caught in a downdraft, breaking below short-term moving averages, which often triggers additional selling. Bond yields fell below certain technical levels, including the 10-yr Treasury yield declining below 4%, which resulted in interest rate-sensitive bonds to rally. More on the technicals below.
- Valuations Elevated in Artificial Intelligence-related Stocks: This has been an area of concern and just another reason for investors to become more cautious. Momentum in these stocks can keep going regardless of fundamentals/valuations until something changes that narrative. The short-term narrative appears to have quickly changed, and momentum-based trades have reversed.
- Small Caps Swift Move Substantially Higher: Small cap equities (measured by the Russell 2000) rallied roughly 14% in about a month, which appeared to be technically-driven (broke above resistance) and possibly some short covering. Inflation data showed continued signs of deceleration with investors believing decelerating inflation will cause the Fed to cut rates, which could benefit small caps. Well, sharp 14% rally in a month isn’t often sustainable, thus some giveback would have been anticipated. As the broader large cap equity markets declined, small caps joined them.
Market Technicals
I invest with a long-term focus, but understanding market technicals in the short term is very important to me. It provides me some insights into what may be moving the markets over the short-term, that is not necessarily an indication of long-term fundamentals. When there are quick, deep market selloffs or significant rallies, market technicals and short-term traders (often computer-driven) may be the blame. If it’s short-term technically-driven, then longer-term fundamentally-driven investors may find an opportunity to arbitrage.
Let’s just look at some markets and their technicals.
Bearish Technicals in Tech: When markets fall below moving averages, selling often accelerates until other moving averages can act as potential support. Technical weakness started 2-3 weeks ago in tech-related equity indices. Here are some charts…
The S&P 500 Index is down just over 6% peak to trough over the last couple of weeks but just broke below its 50-day moving average. The tech-heavy NASDAQ 100 Index and Semiconductor Index broke below their 50-day moving averages and continued to quickly move lower. The 200-day moving average remains potential technical support, about another 5%+ downside for the NASDAQ, and which the Semiconductor Index is currently sitting right on top of. With semiconductors leading the artificial intelligence hype trade this year, we will see how the Semiconductor Index reacts at the 200-day moving average technical support level.
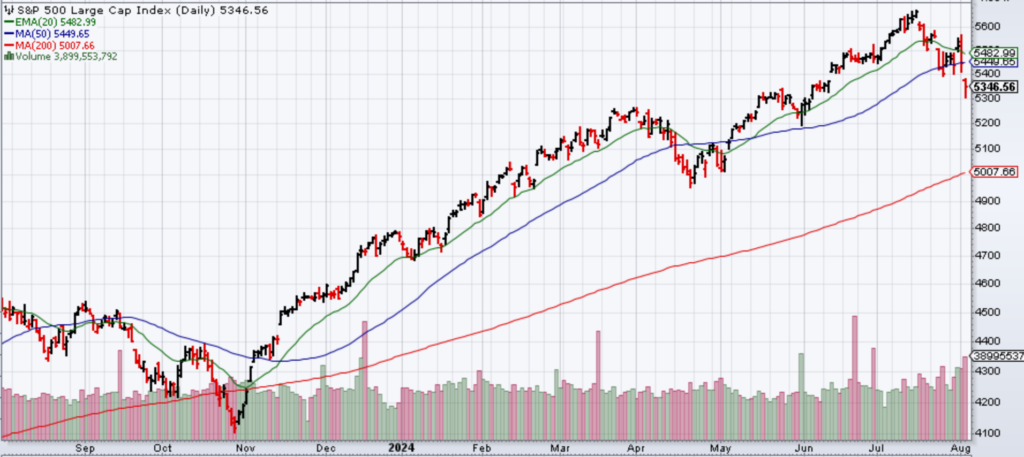
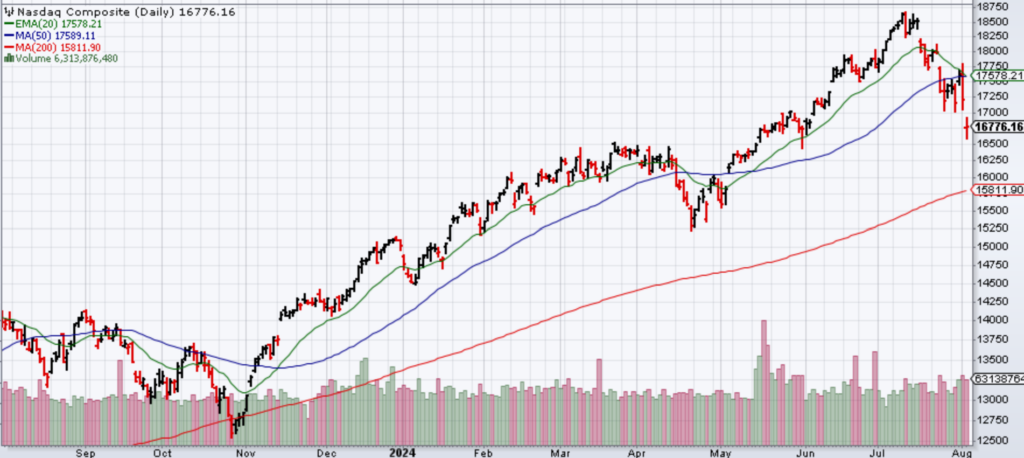
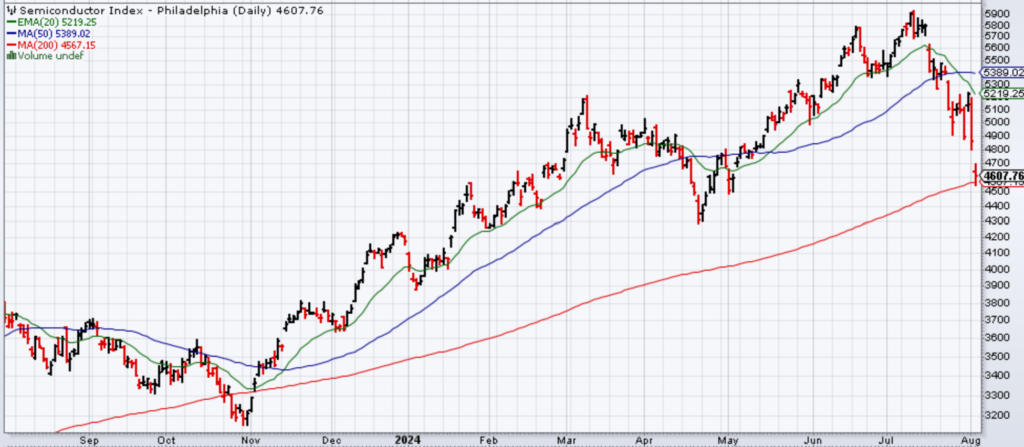
Source: Stockcharts.com 8/4/24
Small Caps Stuck at Resistance: Small caps (Russell 2000, proxy iShares Russell 2000 ETF) had a nice rally after breaking above short-term resistance but fell quickly backwards after it failed to move above its historical resistance at its long-term high set back in 2021.
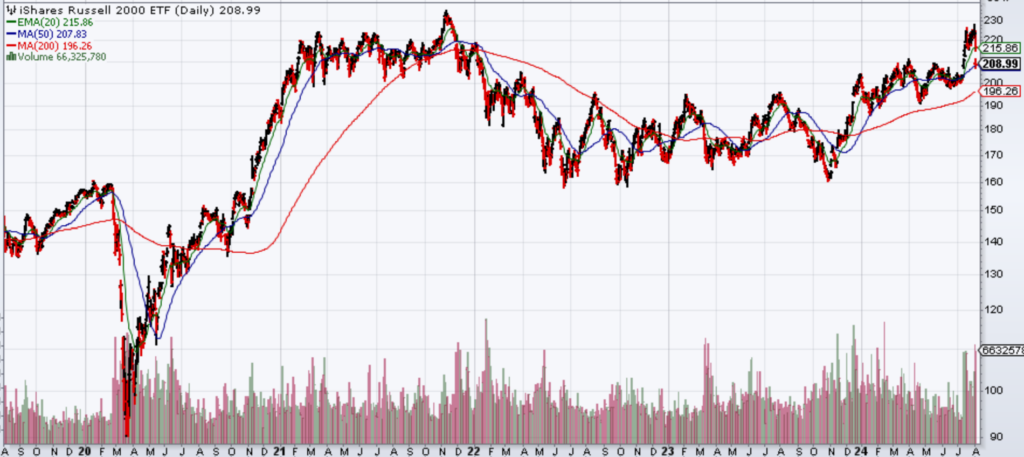
Source: Stockcharts.com 8/4/24
Bonds Rally as Yields Fall: On the bond side of things, the U.S. Aggregate Bond Index (proxy: ishares U.S. Aggregate Bond ETF) broke out above its recent resistance level from earlier this year. Widening out to look at weekly technicals, the Aggregate Bond Index just broke above its 200-week moving average, a short-term bullish sign. We’ll see if it sticks.
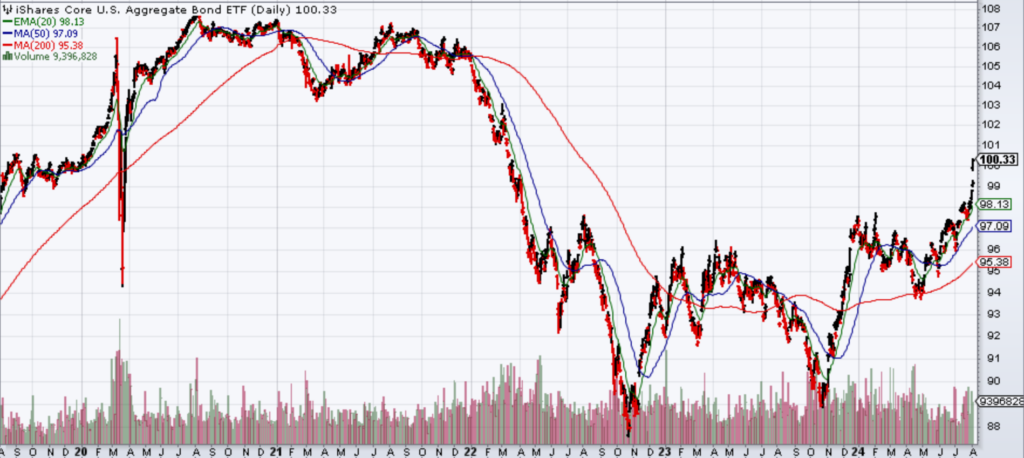
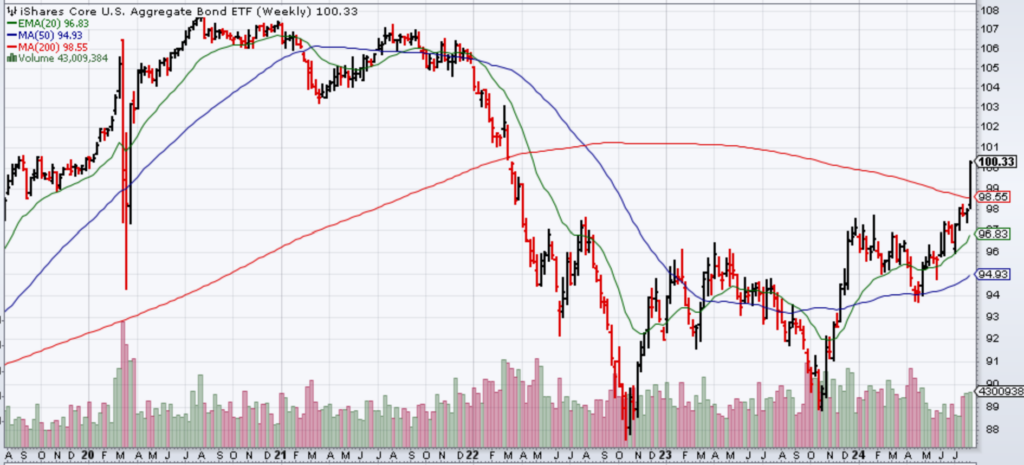
Source: Stockcharts.com 8/4/24
The U.S. 10-Year Treasury Yield broke below the psychological 4% level, now down to 3.8%, close to the lows earlier this year. From a technical perspective, if the 10-year Treasury falls below current levels, it could trigger additional declines in the 10-year Treasury yield, to potential below 3.5% and closer to the support levels in 2023. Remember, falling yields can result in higher bond prices in interest rate-sensitive bonds.
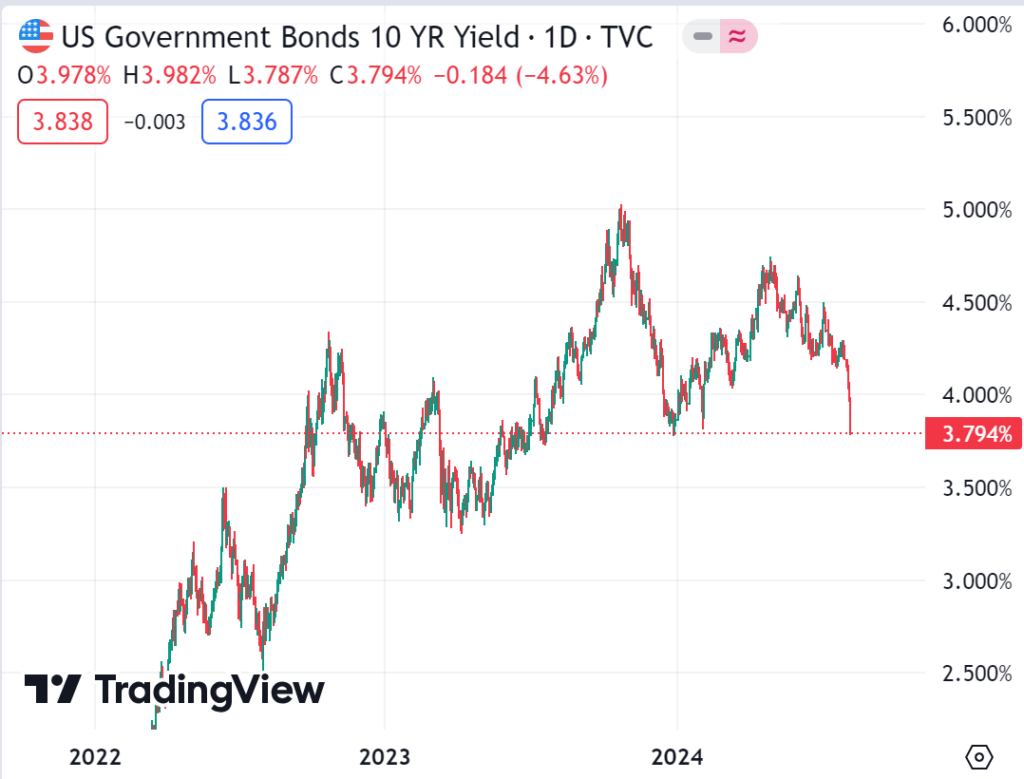
Source: TradingView.com 8/4/24
Summary
So, markets have moved quickly with some weaker fundamental news, but short-term market technicals can often magnify moves one way or another. For short-term traders, sure this volatility can be helpful, but for me as a long-term investor, a lot of it is noise. If markets continue to decline, it allows me opportunities to add to risk, not become fearful and sell into weakness as a momentum trader may be inclined to do. I am not a momentum trader, but I am aware of the momentum drivers of financial markets.
For me, the key is to be aware of market dynamics, be patient, and try to swing at fat pitches down the middle and not swinging at everything just to swing and feel like I’m doing something. Understanding the type of investor/trader you are is important when volatility picks up. Make sure you know yourself in these market environments.