On the August 1st post “Close to Prior Peaks and Resistance Levels”, I indicated that equity markets could struggle to go higher after a strong up move from October of last year and getting close to previous highs. I stated that if markets sold off from there, the 50-week moving average could be an area where investors/traders may want to add risk again. With the recent rally in equity markets, that appears to have been the case.
As interest rates were continuing to move above 5% across the yield curve, equity markets continued to decline. I had a couple of people raise their concern that the continuous selloff in equity markets, plus higher rates, plus challenges in the Middle East were causes for concern. I reiterated that I believed interest rates may have a tougher time to move higher (although it could be possible – ANYTHING is possible), it may not be likely. In regards to the challenges in the Middle East, I reminded the concerned investor that conflicts in the Middle East have been going on for a long time, and the average American will probably continue to upgrade their iPhones, buy new clothes, drive their car, etc., reiterating that consumers and businesses will continue to spend, and companies will continue to generate revenues.
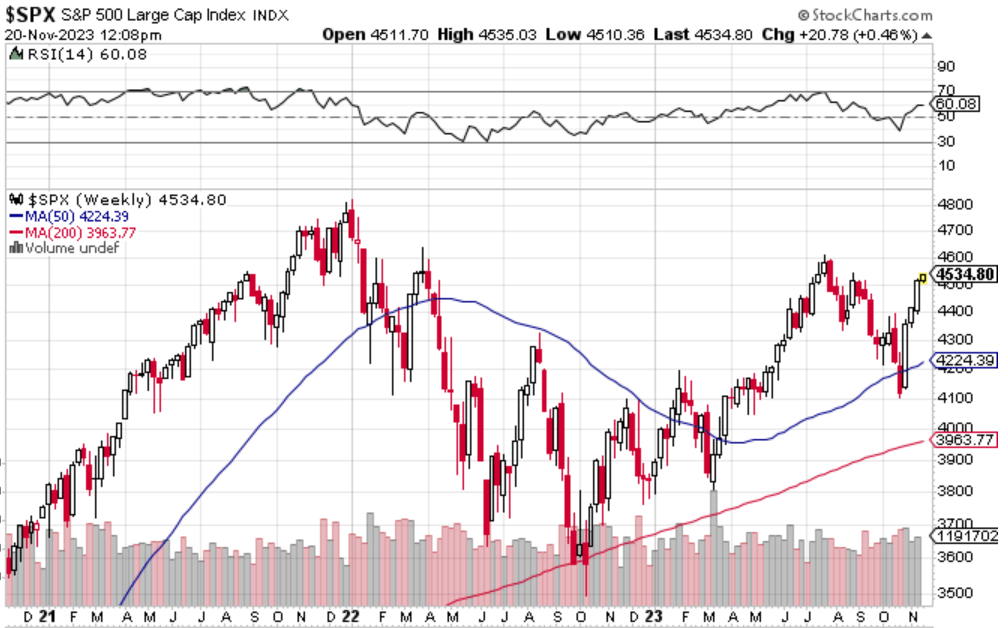
So, if interest rates had the potential to at least pause, and the initial shock of another conflict in the Middle East would pass, then equity markets had the potential to rally after the risk off period. That’s what appears to have happened. You can see the S&P 500, NASDAQ and Dow Jones Industrial Average indices in the charts1 below.
S&P 500 Index
As you can see, the S&P 500 struggled at the prior peak in July, sold off down to and through the 50-week moving average, then rallied strongly back closer to the July highs.
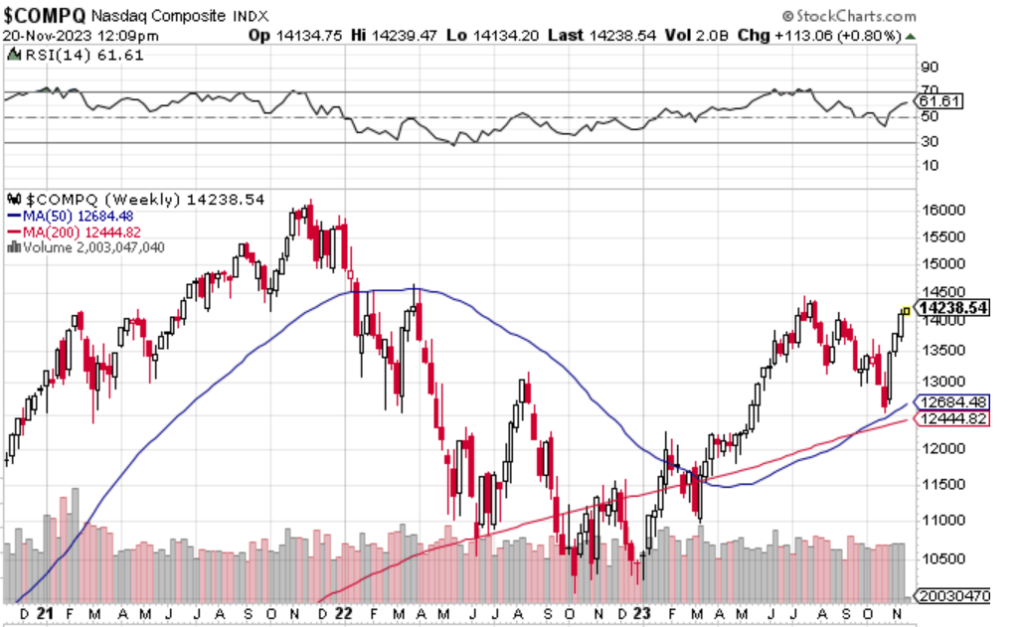
NASDAQ
Same thing with the NASDAQ, bouncing off its 50-week/200-week moving averages. Still has a ways to go to get to the 2021 highs.
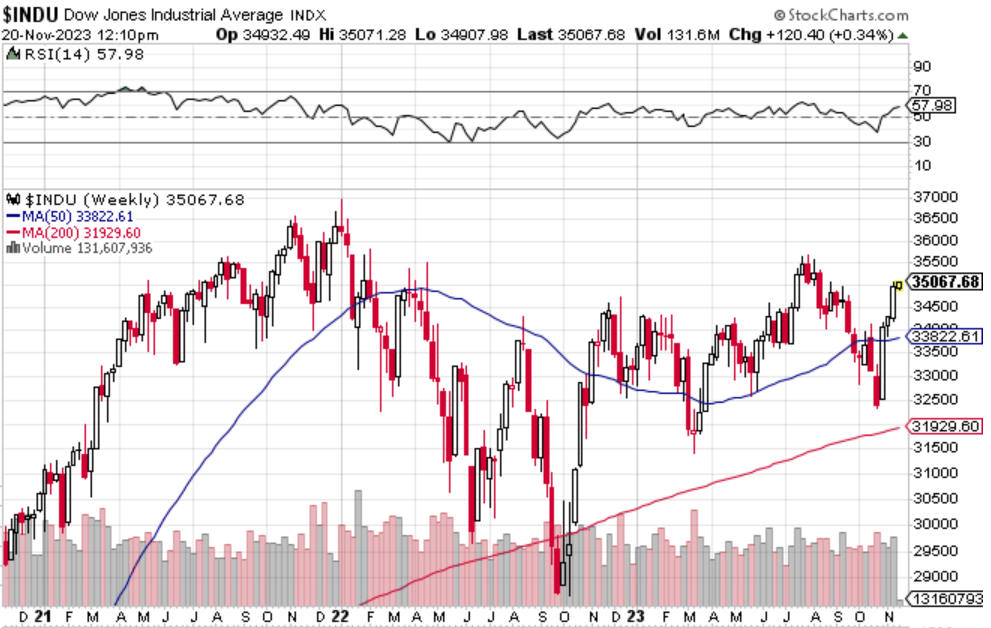
DOW JONES INDUSTRIAL AVERAGE
The DOW broke through its 50-week moving average, traded just above its 200-week and bounced from there.
Choppy Markets: Don’t Get Emotional
Markets are volatile. If you just look at the three charts above, the volatility is clear. If an investor was concerned on each quick selloff of 5-10% for fear of further declines, they may have missed out on very quick rallies to the upside.
Yeah, the broader equity markets really haven’t done much in terms of stock prices.
JUST REMEMBER: You are invested in COMPANIES. The charts above DO NOT represent a company’s revenues, expenses, earnings, profit margins, cash flows, etc. These stock prices are just the supply and demand for the stocks over a specific period of time driven by so many different supply/demand factors (traders vs. investors, short-term vs. long-term perspectives, quant models vs. fundamentals, etc.).
Do not forget what you are actually invested in and consider longer-term perspectives rather than focusing on the short-term noise.
So Now What?
There can be year-end seasonal tendencies where the markets rally through year end. If enough investors/traders believe in this seasonal pattern, the markets can continue to rally from here. Investors/traders that are trying to front-run a potential year-end rally may have already pushed markets to the current higher levels.
No one knows what will happen, but just be aware that short-term seasonal trading factors can move the markets higher, even if fundamentals really haven’t changed in that short period of time.
SOURCES
- StockCharts.com Retrieved from StockCharts.com on November 11, 2023.