We’re pretty close to prior market peaks and resistance levels in the Dow, S&P 500 and NASDAQ indices. This may be an area where the U.S. large cap indices take a breather following huge rallies from the lows last year. From a technical perspective, we need sustained price movement above these peaks in order to get short-term traders further interested in these markets. Until then, these prior peaks act as resistance points.
If you’re not paying attention and the markets stall and/or decline a bit quicker from these levels, this is one of the potential reasons of the markets doing so. It does not mean that anything is broken or something fundamental has seriously changed. If you focus on trading, the blue (50-week moving average) and red (200-week moving average) lines in the charts below could be areas that the markets bounce off of.
So what can longer-term investors do? Simple: Rebalance
Portfolio Rebalancing
Set an allocation target for an investment. If the investment rallies to a weighting 10-20% above that target allocation in the portfolio, consider reducing that exposure back to the target allocation in the portfolio. If the investment declines and the allocation is below the target allocation, consider adding exposure back to the target allocation. This simple act of rebalancing can add value in volatile market environments which we have recently experienced and anticipate will continue to experience into the future.
If you rebalanced your portfolio towards the lows last year, effectively buying low when your equities sold off, consider rebalancing again (selling high) since some of your investments you added to may have significantly rallied from those lows.
A simple look at the volatility, peaks and troughs of the indices below can help provide context of how disciplined rebalancing can take emotion out of investing and potentially add value over time.
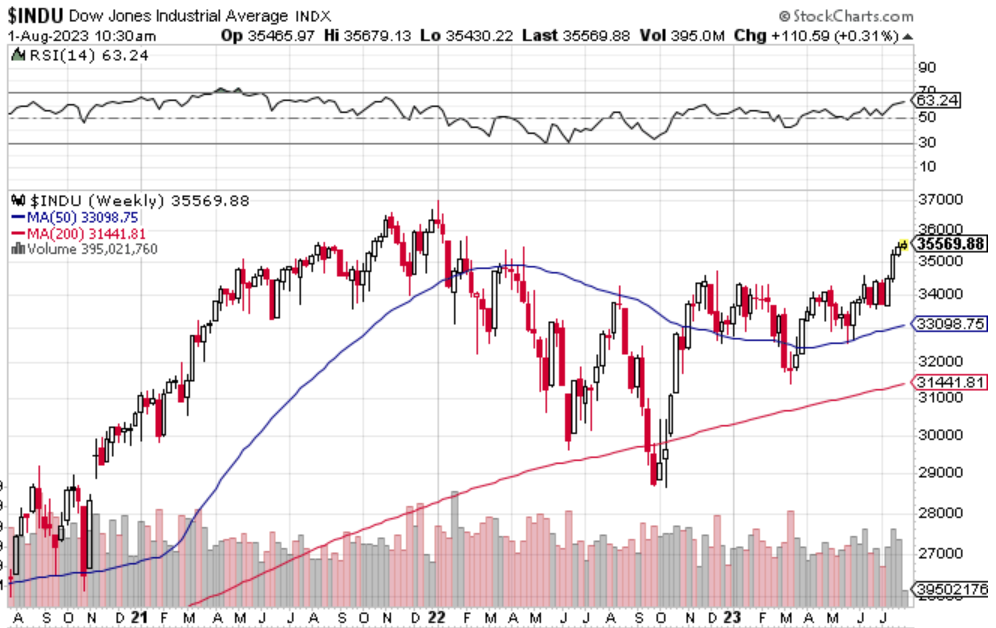
Dow Jones Industrial Index
The Dow is the closest to its prior peak of the other indices, and also a bit more diversified outside of technology-related companies than the S&P 500 and NASDAQ indices. Exceeding its peak before the others would be something to keep an eye on.
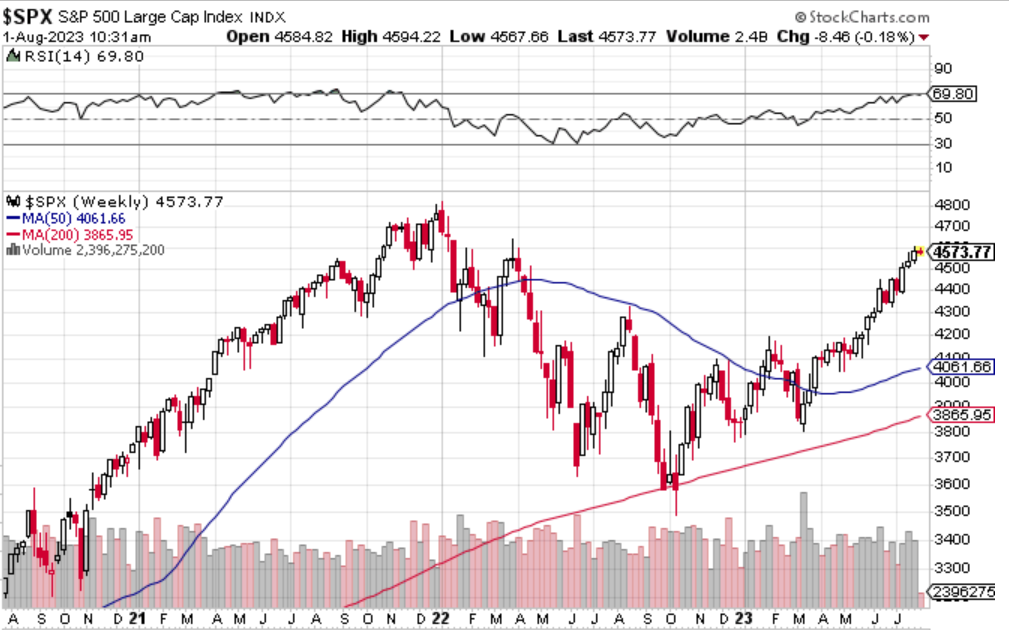
S&P 500 Index
The S&P 500 has rallied to 4600 but still around 5% below its peak, so a little room before it hits its technical resistance peak.
From a company allocation index perspective, think of the S&P 500 Index to be a bit between the Dow and the NASDAQ. More tech-related company exposure than the Dow but less than the NASDAQ. I prefer to use the S&P 500 as the broader index when discussing the markets.
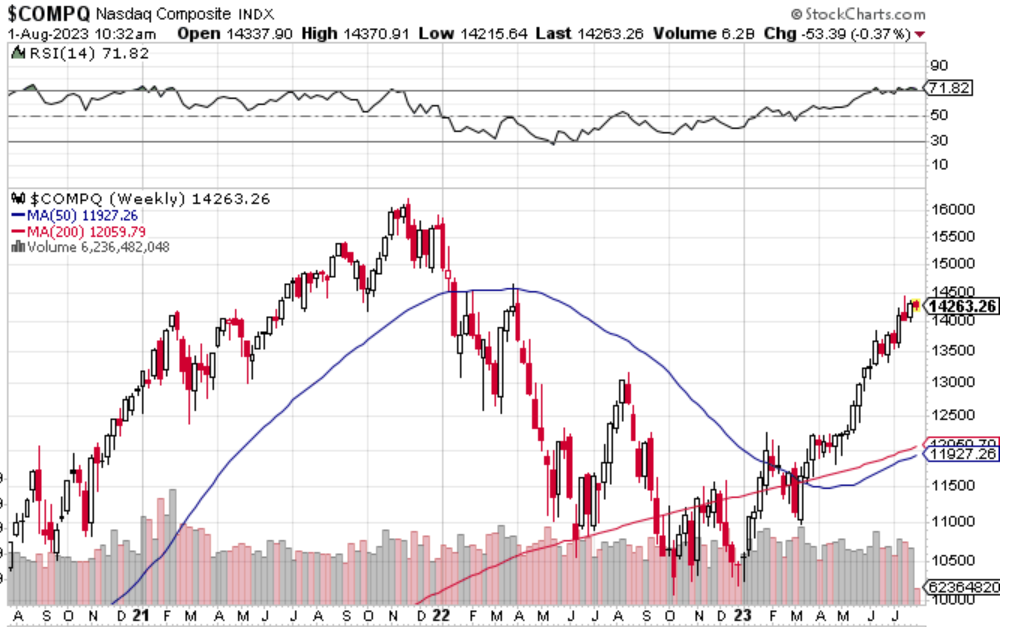
NASDAQ Index
The NASDAQ, a heavier tech-related index and excludes companies classified as “financials”. So when tech stocks declined significantly in 2021/2022, the NASDAQ got hit the hardest of the three. Now as tech stocks have rallied this year, the NASDAQ is outperforming the Dow and S&P 500.
The NASDAQ a ways to go to its prior peak, but it also started from a much higher valuation than other parts of the market back in November 2022, so earlier weakness prior to the peak wouldn’t be surprising. Drawing a line from its current level to February 2021 and April 2022, you can see its hitting non-peak resistance levels that short-term traders will also keep an eye on.