This is the Part 2 follow-up to my first post on the elections, titled Don’t Let the Emotions of Politics Impact Your Investment Decisions posted on November 16, 2024.
Now that we have confirmation that the Republican party controls the White House, Senate and House of Representatives, there is a higher probability that the Republican party can implement their fiscal policies. So let’s set the goalposts and see how they do.
During election season, politicians are trying to get your vote. Depending on the candidate, what they say may not be something that can actually be implemented. Candidates may overpromise and underdeliver. They often promise tax cuts, lower costs, faster economic growth, to fix the deficit, offer better education, a stronger military, etc. Ok, yeah, mmm-hhmmm, sure. I care a lot more about actions than I do just words.
I work in an industry where someone overpromising and underdelivering can be pretty detrimental to the client. The more confident someone sounds, the more cautious I usually am. Salespeople are often looking to get sales then move on. Some will overpromise, underdeliver, and then blame others or external factors for things not working out even though you knew they were overpromising and probably wouldn’t deliver. Ok, not everyone is like this but I’ve come across enough of them, and the worst ones you don’t forget.
I hold people accountable for their promises by measuring facts. As an investment portfolio manager and research analyst, I’m measuring facts all the time. As I hold people in my industry accountable, and my clients hold me accountable, I hold politicians accountable as well.
In the U.S. government, there has generally been political gridlock, where there were balances of power across Democrats and Republicans, with different majorities across the White House, House and Senate depending on the time period. Since this time is a little different, with Republicans taking control of all three, there is a real chance that fiscal policies can actually be implemented and enacted into law. With that level of control, we can now try to hold the politicians accountable for what they said during election season and measure what actually happens, backed up by data.
I think there are very smart Republicans and Democrats. Like investors, all politicians have an opinion. Some might end up being correct, and some might be wrong. Both Republicans and Democrats have high conviction in their policy beliefs. Maybe both political parties have policies that can work and benefit Americans, just differently.
I think the U.S. and broader global economy is so dynamic and so complex, that no political party or politician knows with ultimate confidence what will actually benefit all people all the time. Why do you think there are so many different leadership structures throughout the world? Even within the Democratic and Republican parties there are disagreements. Just please don’t fall for confident sounding speakers. I don’t think one person or one political party has the magic solutions that will save everything and everyone.
Only time will tell as it takes time for policies to be implemented and for the effects to be felt. It’s kind of like investing. I just hope no one massively screws it up so we can’t recover. I hope that those in political power can enact policies that are beneficial for all Americans. Even if the policies don’t work as promised, I just hope it’s not so bad that we can’t recover from it. This is for all politicians and all political parties.
Looking back in history, through the policies of different leaders and political parties, we’ve been able to succeed over time and recover from the various crises that have popped up. We’re still the strongest country in the world on many fronts, in my opinion. Let’s hope that continues.
About This Piece
This piece is economically focused and not meant to have a political bias towards any political party. I’m going to ask you to think for yourself as to how you think supply and demand is impacted by fiscal policies and how fiscal policies may impact future economic data. I’ll address widely-known topics, ask you to think about different outcomes and utilize easily available data that anyone can look up at any time for free. Let’s hold the politicians accountable.
As a U.S. citizen, you should want to educate yourself about these topics and understand the basics of economics. I think a lot of people agree, we need better financial and economic literacy for all, so consider this piece as me trying to help provide some education. It’s up to you to take it or leave it.
“Yeah, but I’m not great with numbers”. You don’t need to be. These are simple, straight forward concepts that everyone should know, with some simple data sources to check up on over time. Let’s keep the politicians honest and hold them to do what they say they are going to do. There is a reason a lot of people don’t trust politicians.
Based on the information provided in this piece, come up with your own conclusions. For each situation, ask yourself: Depending on the government policy, and based on simple economic concepts, will the numbers go up or down?
Most of the economic data is pulled from the Federal Reserve Bank of St. Louis Economic Data “FRED” website. I use this site a lot as a investment portfolio manager and analyst. The site pulls economic data from a variety of government sources and provides it in an easy to generate, graphical and downloadable format. The sources are listed so you can pull the data on your own at any time. I don’t want anyone claiming false data or “fake news”. This isn’t political, it’s just factual data.
I pulled most of the data going back to 2000. Feel free to do your own analysis of the data and compare when different political parties were in leadership over the last 20+ years. Only you can determine whether or not the data was good enough for your personal situation.
Quick little note: When you look at the numbers, just remember the COVID lockdown periods during and after. When I show historical data, you’ll see big swings in data from 2020 through 2022, with some leveling off of the data after that. If you understand simple economics and that supply and demand drives inflation/prices, you’ll understand the reasons for the data swings and not be swayed by political statements from any political party.
In this election, it seemed like voters thought the economy was a big issue for them, so let’s get into some of the big topics, Republican polices (or at least from Trump), and the potential economic outcomes from those polices.
Inflation
Supply and demand drives inflation. Think of inflation as the changes in prices of goods, services and wages paid.
Inflation has been a huge topic for voters, so you should at least know the basics on inflation.
Always remember the following relationship of supply and demand. It’s really simple…
- When Demand > Supply = Higher Inflation
- When Supply > Demand = Disinflation (slowing inflation) or Deflation
If you have more demand than available supply, people will pay more for the supply available (inflation). If you have less demand for something, then prices will be cut (deflation).
If you don’t have enough supply to cover demand, prices go higher. (inflation). If you have too much supply and not enough demand, prices go lower (deflation).
For every topic in this piece, just keep this supply/demand framework in mind and you’ll be able to at least have an educated guess which way the economic numbers could go under Republican political leadership and the policies implemented.
What factors impact demand and supply in an economy?
- What Impacts Demand (the spending of money)
- economic growth
- change in the amount of money to spend
- government sends checks to citizens
- tax cuts/increases
- you get a job wage increase/decrease
- you lose your job
- government spending
- the desire to spend
- spending more during/after a crisis (COVID lockdown)
- artificial price controls
- government forced tariffs on lower-priced foreign imports impacting demand
- What Impacts Supply (the availability of something)
- number of available workers (labor supply)
- availability of parts/supplies to create products
- ability to profit from creating supply for others to buy
- artificial price controls
- government forced tariffs on lower-priced foreign imports impacting available foreign imported goods/supplies
Think For Yourself: Ok, now take a moment. Think about different aspects of the economy, about the impact of COVID, tax cuts, government spending, interest rates, tariffs, deportations, corporate profits, the stock market, and any other factors and their impact on supply and demand. That will help you understand the impact on inflation today, how it moved in the past, and where it might go in the future.
- Think about eggs: Is there more or less supply of eggs? Look into the impact of avian flu on egg supply.
- Think about housing: Is there more or less supply of housing? Look into the impact of less housing development.
A lot of the fiscal policies driven by the Republican party could impact inflation. You can come to your own conclusion if it increases or decreases inflation and how it impacts you personally and the U.S. as a whole. Just remember how supply and demand impacts inflation as noted above.
Let’s first set the goal post on inflation. Prior to the election results, inflation was trending lower to the 2-2.5% range on CPI and Core PCE based on current polices. The U.S. Federal Reserve has a 2% inflation target and adjusts monetary policy to get and stay there.
Trump indicated he would bring prices down (deflation). This is different than slowing the rate of price increases (disinflation). Disinflation has already been happening since inflation peaked, so based on Trump’s statement of lowering prices, the U.S. needs to shift to a period of deflation. If prices can actually decline during a strong economic environment, that could be great for U.S. citizens.
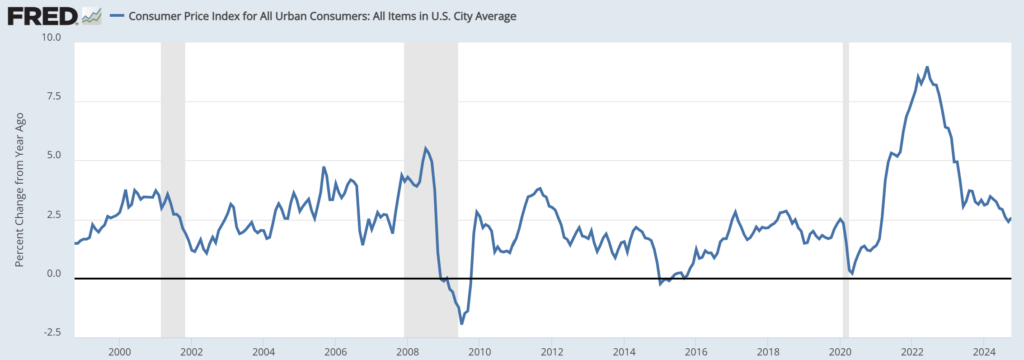
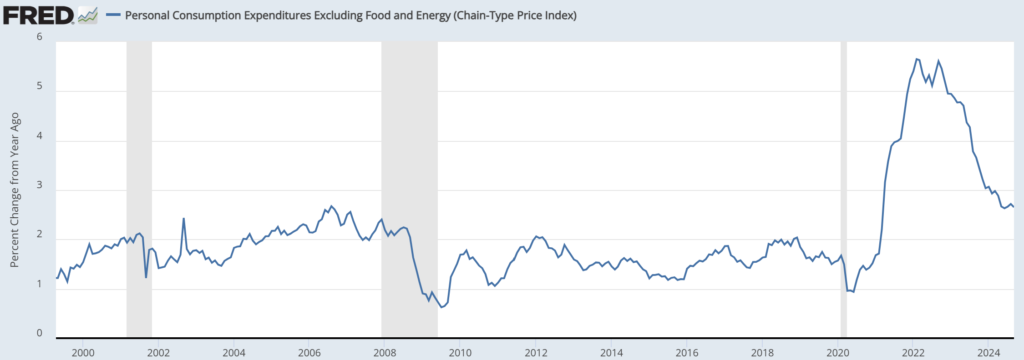
In a deflationary environment where prices of things actually decrease, we would need to see the Consumer Price Index (CPI) and the Personal Consumption Expenditures Excluding Food and Energy (Core PCE) go negative for prices to fall. Here is where we currently stand relative to history…
Consumer Price Index: 2.6% (October 2024)
Personal Consumption Expenditures Excluding Food and Energy (Core PCE): 2.7% (September 2024)
Think For Yourself: Based on Republican fiscal policies, do you think CPI and Core PCE will decline and prices of goods and services will decline? Who ultimately controls the prices of things? Who ultimately benefits from falling prices? Think about companies. If companies’ costs decline, do you think companies will immediately pass the savings onto consumers/businesses by reducing their prices, or will they keep prices the same and generate higher profits for themselves?.
We’ll just need to monitor how these inflation metrics evolve over the next few years to see how the polices actually impact inflation.
Immigration
This is such a hot topic. For the purposes of this topic, I will use the term “illegal immigrants” to refer to non-U.S. citizens that are living in the U.S. that are not here legally. I know there are different terms that can be used, including undocumented immigrants, unauthorized immigrants, asylum seekers, etc. Since Trump uses the word “illegal”, I will use the term as well to align with what his polices might be.
Trump’s deportation policies may be as broad as including any non-U.S. citizens living in the U.S. illegally without documentation, or it may be a bit more focused on those illegal immigrants that have committed other crimes while in the U.S. We’ll have to wait and see.
Labor data shows that there are non-U.S. citizens without appropriate documentation/authorization that are working within the U.S. economy. With that basic assumption, there is a supply and demand equation to think about as it pertains to immigration and deportation policies…
- Need for Workers (demand) > Number of Workers (supply) = Higher Wages
- Need for Workers (demand) < Number of Workers (supply) = Lower Wages
If you’re a business owner and you need more workers than are available, you’ll need to pay higher wages to attract more workers. If there are more workers that want to work for you than you have a need for, you can pay less for those workers. Simple.
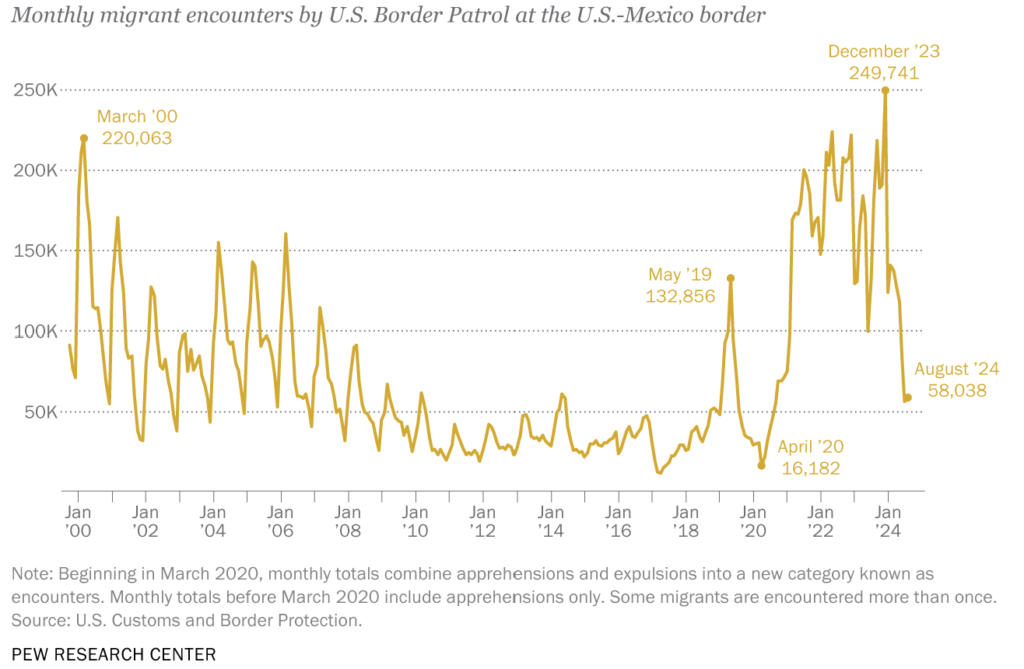
Data indicates that illegal immigrants work throughout the U.S. in different industries. During the election season, Trump indicated a desire for shutting the border with a deportation of illegal immigrants. Trump stated that illegal immigrants are taking jobs away from American citizens.
Assuming at least some of the illegal immigrants work somewhere, simple math would indicate that the deportation of these working illegal immigrants would mean a reduction in the potential number of workers (less labor supply).
Maybe, as some have claimed, there are American citizens that just aren’t working right now because illegal immigrants currently occupy the jobs they want, and those Americans will take those jobs once the illegal immigrants are deported. Time will tell.
Think For Yourself: Now ask yourself. Will there be more or less workers available following a deportation of illegal immigrants? You should also ask yourself, will American citizens demand the same, higher or lower wages than illegal immigrants for the same jobs? Your answer to these questions will help you determine whether or not the U.S. unemployment rate goes higher or lower, whether wages go higher or lower, and whether inflation goes higher or lower.
With Republicans pushing for a policy of deportation, shutting the border and slowing immigration, that could potentially shrink the labor supply of all immigrants and might increase employment opportunities for U.S. citizens. It is also important to note that it may also translate into higher wages being paid.
Remember: Demand for Workers > Supply of Workers = Higher Wages
Think For Yourself: Now, if deportation leads to less workers and higher wages, ask yourself… Will higher labor costs (due to higher wages) impact a company’s bottom line (profits)? Will companies keep their prices on products and services they sell to customers the same even if labor costs are higher, leading to lower profits? Will companies lower prices in a higher labor cost environment, leading to lower profits? Will companies prefer to generate higher profits and raise prices to try to cover the costs of higher wages? Will this lead to higher prices that consumers and businesses now have to pay, resulting in higher inflation?
Remember…
- Profit = Revenue – Costs
- Higher Prices = Higher Inflation
- Slowing Price Growth = Disinflation
- Lower Prices = Deflation
Feel free to go through the mental exercise of how immigration policies may impact the U.S. labor supply, the unemployment rate, wage levels and corporate profits.
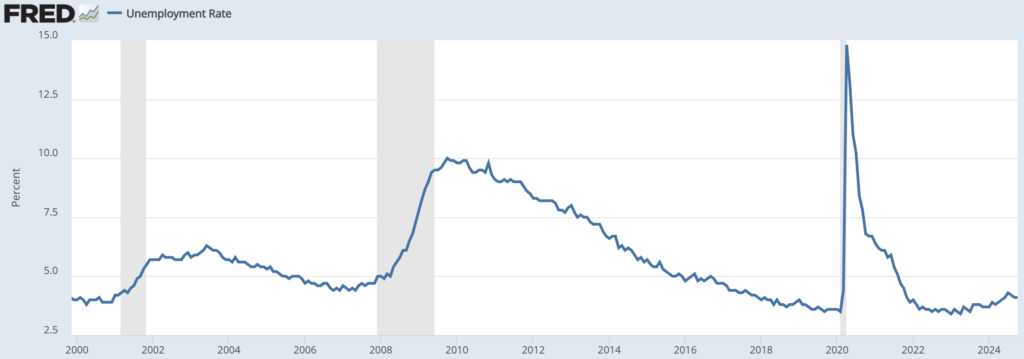
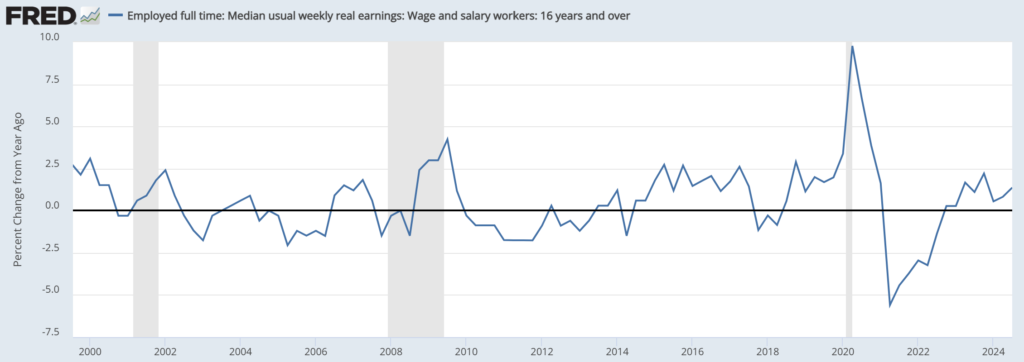
Let’s keep an eye on the level of unemployment (people not working), civilian labor force (people working), and the annual wage increase over time. I would assume political leadership would want the unemployment rate to stay low, have a healthy amount of workers to support our economy, and average wages increasing higher than the rate of inflation.
Unemployment Rate: 4.1% (October 2024)
Civilian Labor Force Annual % Change: 0.5% (October 2024)
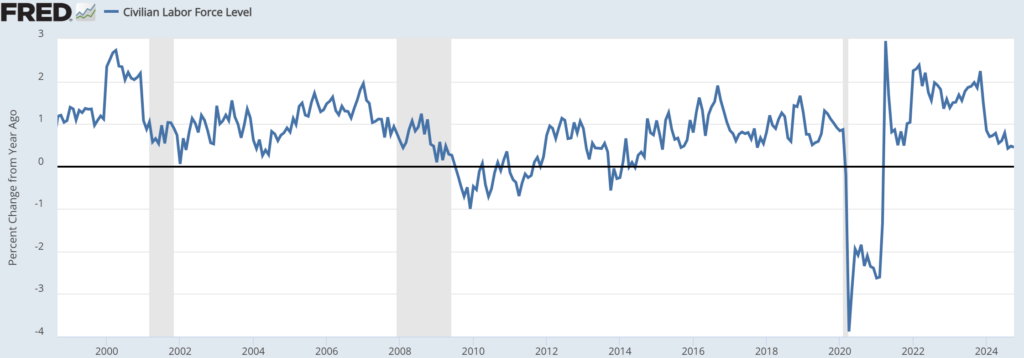
Annual Real Wage Growth: 1.4% (October 2024)
Tariffs
Trump has indicated that he is a fan of tariffs. He seems to like tariffs as either to generate additional revenue for the U.S. government, or as a negotiating tactic for other things.
Just remember, government-forced tariffs on goods and services generally increases the price higher than what the foreign entity would like to sell it for to U.S. citizens. Maybe there are subsequent positives of the tariffs to consider (move to American made products/services, etc.), but at a minimum, for that foreign good/service, a tariff increases the price.
Think For Yourself: Will tariffs increase prices, thus increase inflation, or not? Are you willing to spend more for foreign items that you are used to paying lower prices for? Will tariffs on foreign goods/services result in an economic benefit for you? Will foreign governments retaliate and increase tariffs on U.S. exports? Will a tit-for-tat tariff environment be beneficial for large multi-national U.S. companies that try to sell goods and services outside of the U.S.?
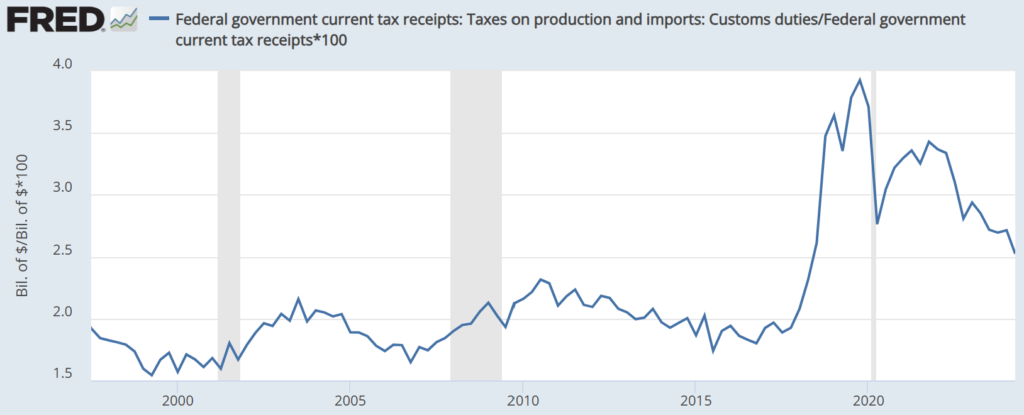
So how can we track taxes from tariffs? We can look at the aggregate tax collected and the percentage of taxes collected from tariffs relative to total taxes. Based on Trump’s proposed tariff and domestic tax policies, we can watch to see if the taxes from production and imports in aggregate and relative to total tax receipts materially increases over time.
U.S. Government Tax Receipts (Q2 2024)
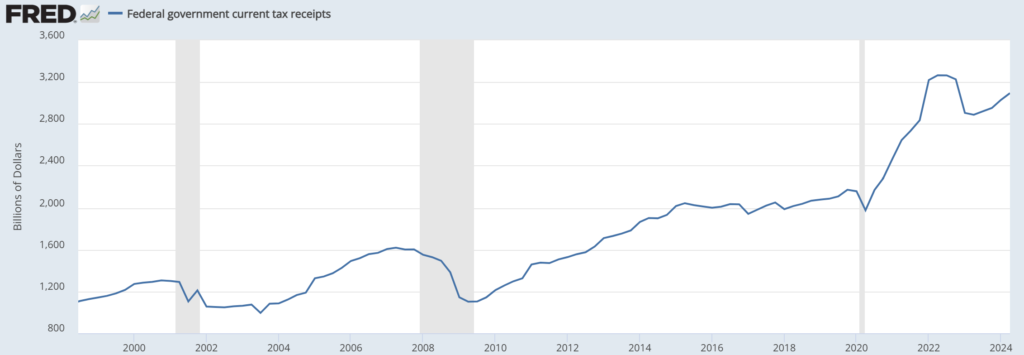
Taxes on Production and Imports (Q3 2024)
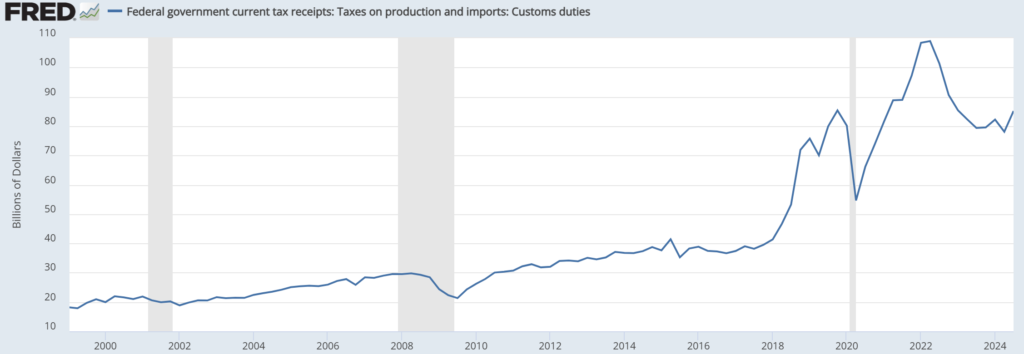
% of Taxes on Production and Imports vs. Total Federal Government Tax Receipts (Q2 2024)
Taxes
Both presidential candidates talked about cutting taxes. Trump talked about cutting taxes on tips, Social Security, corporate tax rates, getting rid of income taxes and a bunch of other things. Guess we’ll just have to wait and see.
With Republican power in place, the Trump Tax Cuts and Jobs Act passed in 2017 may remain in some form rather than expire at the end of 2025. That’s a potential win for those that are taking advantage of the current tax levels.
The biggest economic boost tends to come after a major tax cut. To get another economic boost, Republicans may need to cut taxes further. The tax cuts of 2017 were broad and deep, so I would think it would be potentially difficult to have another major, deep tax cut from current tax levels.
Any tax cut implementation will take a delicate balance to make sure growth can be strong while managing the deficit and federal debt levels. While politicians often believe tax cuts will be recouped from higher economic growth due to those tax cuts, it will take time to see if that actually happens.
Think For Yourself: When the Trump tax cuts were implemented in 2017, did your effective tax rate go up or down? Do you believe the owners (private / public shareholders) of your company or you received more benefits from the 2017 tax cuts? Have tax cuts increased or decreased the U.S. deficit?
Taxes are very personal and tied to your personal situation or a company’s own situation. Just pay attention to your past, current and future effective tax rate.
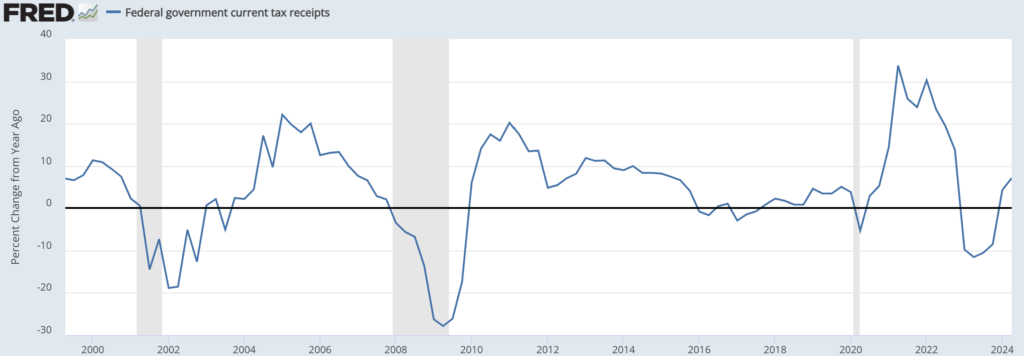
In regards to tracking the U.S. federal deficit and tax revenues, we can just watch the Federal Tax Receipts over time…
Federal Government Tax Receipts Annual % Change (Q2 2024)
Economic Growth
I’m sure all politicians want strong economic growth. What we want is strong Real GDP, which is economic growth after the effects of inflation.
Just remember…
- Nominal GDP – Inflation = Real GDP
Focus on Real GDP. If Nominal GDP increases 3% just based on prices going up 3% (inflation), then Real GDP is actually 0%. You don’t get credit for higher Nominal GDP just because of higher inflation, so focus on Real GDP.
On average, U.S. Real GDP generally trends in the 1-3% without much trying, so we would need to see something better than that on a sustainable basis. If that is the case, then an economic win for Republicans would probably be Real GDP growth over 3% on a sustainable basis.
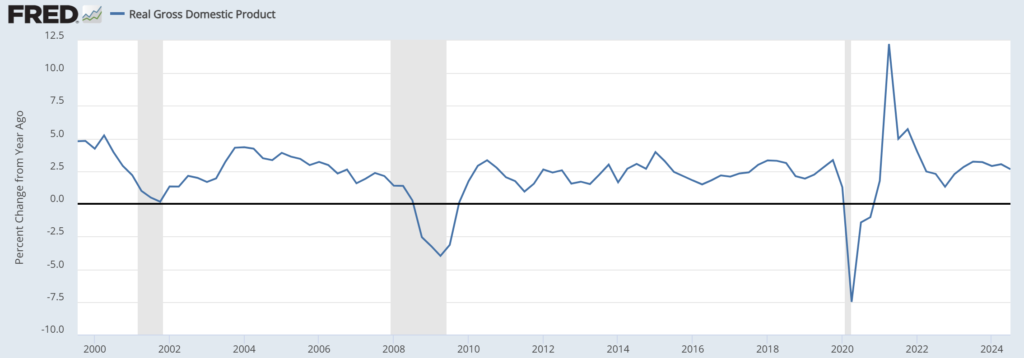
Let’s keep things simple. Here is the annual U.S. Real GDP % growth over time and what it is today. You can make a determination at what level of Real GDP growth you would give Republicans a win.
U.S. Gross Domestic Product Annual % Change: 2.7% (Q3 2024)
Think For Yourself: Based on the economic policies listed in this piece and anything else you want to add, do you believe Real GDP growth will be higher, stay the same or decline under the new Republican political leadership?
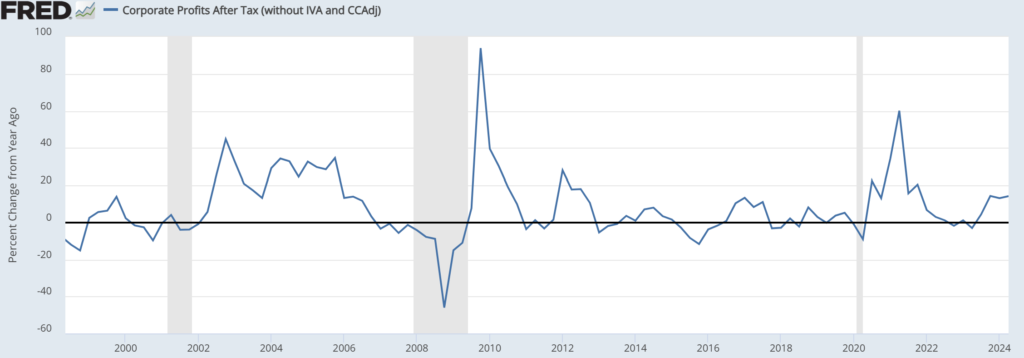
Profit Margins
Based on historical political beliefs, people may believe the Republican party is good for business. Trump comes from the business world so people may think this will translate to a strong environment for U.S. businesses.
People may believe that policies around Made in America, American jobs staying home, cutting taxes, strong economic growth, etc. should translate to even better profit margins for U.S. companies.
Think For Yourself: Based on the economic policies listed in this piece and anything else you want to add, do you believe U.S. company profit margins will be higher, stay the same or decline?
This should be easy to track, and again, let’s keep this simple. Here are the profit margins of U.S. companies in the S&P 500. We can easily keep track of this to see how government policies might be impacting corporate profits.
Corporate After-Tax Profits (Q2 2024)
Jobs
In a stronger economic environment that the Republicans hope to deliver, one would want to look at unemployment and real wage growth.
The unemployment rate is already on the lower end of the historical range based on the U.S. economy performing well the last couple of years.
Maybe strong economic growth and the deportation of illegal immigrants will lower the unemployment rate and raise real wages even higher. We’ll just need time to see if the various policies translate to a better job environment for American workers.
Think For Yourself: Will the Republican policies reduce the unemployment rate further and increase real wage growth for American workers?
Unemployment Rate: 4.1% (October 2024)
Annual Real Wage Growth: 1.4% (October 2024)
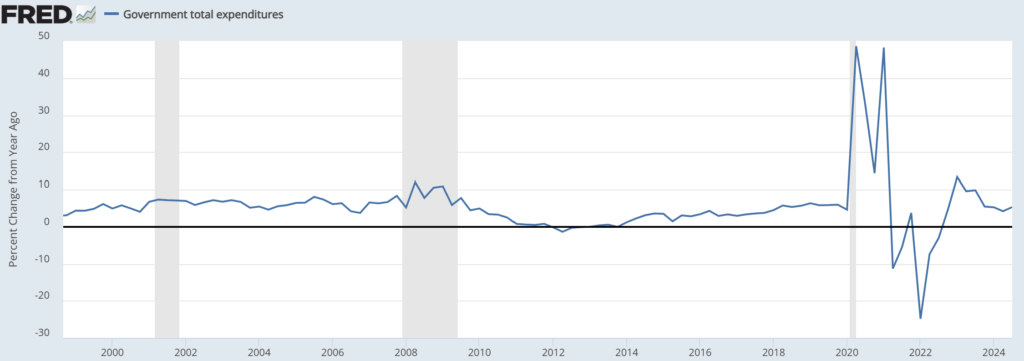
Government Spending
U.S. deficits and the increasing U.S. debt should be a real concern for U.S. citizens and the world. To manage the U.S. deficit and outstanding debt, government spending needs to be addressed.
The Republican party often talks about entitlements (Social Security, Medicare/Medicaid, etc.) when discussing spending reductions. Republicans also often discuss the need for increased spending on military defense.
I’m sure there are areas of spending where some people think it’s needed and others determine it’s wasteful. That’s up to the politicians in power to decide and the citizens to voice their opinions one way or another through voting.
Trump has announced a new Department of Government Efficiency (DOGE), with co-leadership by Elon Musk and Vivek Ramaswamy. Are you aware that “DOGE” is also the name of a cryptocurrency that Musk has been promoting for a while?
I’m sure there are some opportunities for increased efficiency and wasteful spending. Hopefully someone can figure it out for the benefit of American citizens.
Think For Yourself: Where do you think areas of spending cuts should occur and why? Should government spending include support for those less fortunate or not (this is more philosophical, but a driver of political discussions)? Should we spend more money on military defense?
If the government reduces spending, all else equal, economic growth could decline as government spending is a calculation in GDP.
GDP = private consumption + gross private investment + government investment + government spending + (exports – imports)
Let’s track government spending. If Republicans have indicated a focus on cutting wasteful spending in government, we can watch to see how government spending changes.
% Change in Annual Government Spending: 5.3% (October 2024)
Deregulation
This term is thrown around a lot and that Republicans are good for deregulation. My default assumption is that people believe that under Republican control, deregulation means that costs for corporate regulation will decrease and profits will increase for companies. I don’t think anyone has any concrete numbers or proven benefits from widespread deregulation so I personally don’t put any real weight into it.
Maybe there will be less restrictions on mergers & acquisitions and other business activity. As long as these business activities remain high quality without significantly overleveraged deals, this could be beneficial to general business conditions. Each deal will need to be looked at directly and what’s good for a company doesn’t necessarily mean it’s good for the general public.
Think For Yourself: Is deregulation good for business, good for the general public, both, neither? Can you use deregulation as a broad term or should it be more specific to the specific case of deregulation?
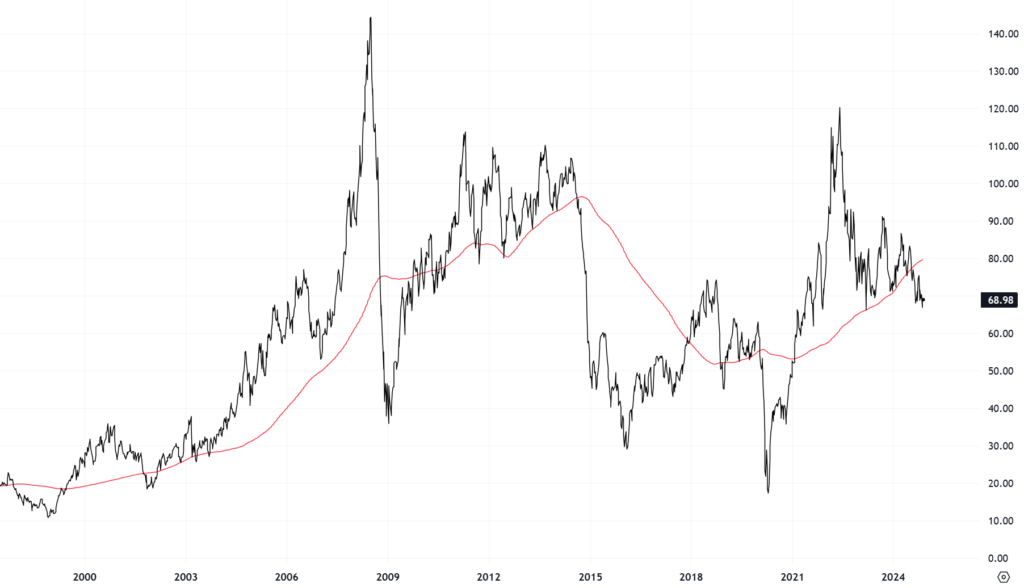
Oil Prices
Like a lot of things in this piece, oil prices are also driven by supply and demand. The Republican party appears to be focused on increasing supply in the U.S. to bring oil prices down. Trump has indicated his desire to “Drill baby, drill!” and calls for expanding pipelines to reduce energy prices.
If American citizens and companies pay less for energy, there can be more money in their pockets to spend. If we rely more on U.S. energy production rather than foreign production, we may have stronger energy resilience in periods of conflicts in the Middle East.
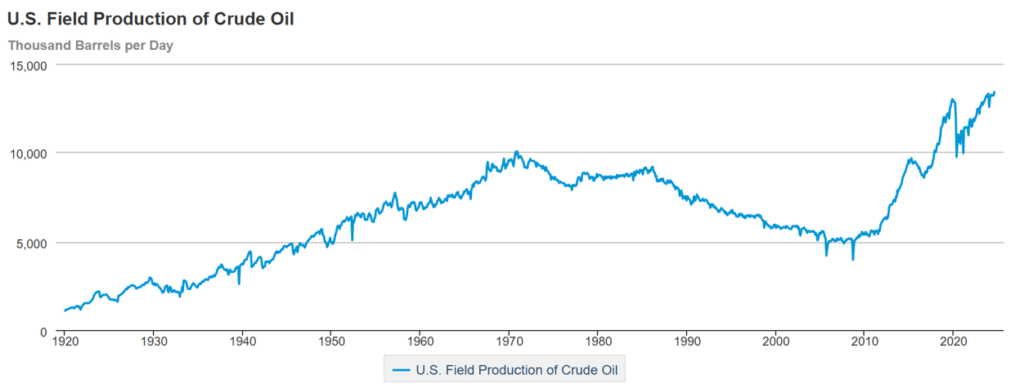
Think For Yourself: Do you think a “Drill baby drill!” and more pipelines policy will materially increase the production of U.S. Crude Oil and reduce WTI Crude Oil prices to a sustainably lower?
This is an easy one to track as well. We’ll just track WTI Crude Oil. WTI Crude Oil generally trades in the $60-$90 per barrel range, with prices and volatility based on the economic environment, geopolitical uncertainty in the Middle East, and leveraged oil commodity traders moving the market.
So, if the goal is to reduce oil prices, I would think a number below the typical trading range makes sense. Maybe that’s WTI Crude Oil at $50 and lower on a sustainable basis.
U.S. oil production has actually increased pretty substantially the last few years. We can also look at U.S. oil production, so let’s keep an eye on that.
WTI Crude Oil: $69/bbl (November 18, 2024)
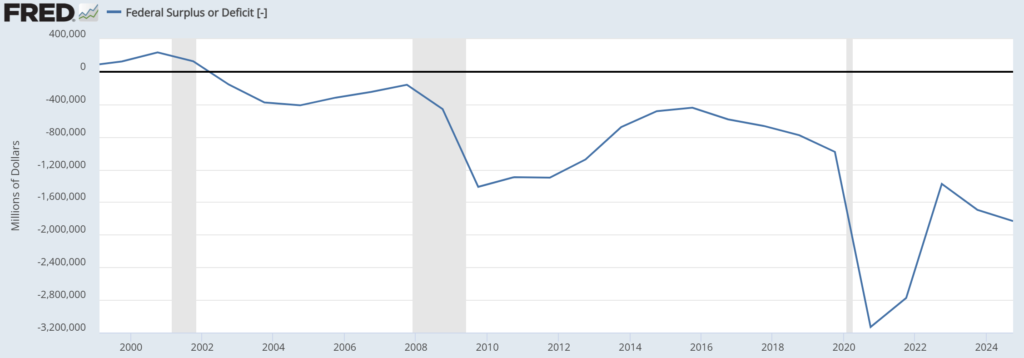
U.S. Deficit
If Republican policies can increase economic growth at a faster pace, generate higher government revenues (taxes), and cut government spending, then the U.S. federal deficit could decrease. If structural changes are made, maybe we can even get to a federal surplus.
There are so many factors that will ultimately impact government revenues and expenses, including those mentioned in this piece, so let’s just keep track of the calculated U.S. deficit/surplus over time…
Annual U.S. Federal Surplus or Deficit: -1,832,816 (October 2024)
Think For Yourself: Is it good to maintain a heavy government deficit? Is deficit spending (borrowing to spend more now) good for current citizens (and politicians) or future citizens? How do you personally measure future government revenues relative to a current budget deficit? If lower taxes that cause a current budget deficit can’t generate higher future government revenue, then what? If cutting government spending to cut expenses lowers GDP, will GDP be strong enough to generate enough revenues to impact the U.S. deficit?
U.S. Debt
Economic growth driven heavily by overspending money a government doesn’t have, doesn’t count as a economic success, in my opinion. While current citizens reap the benefits of pulling forward growth for the benefit of themselves, it results in placing the debt burden on future citizens. Neither current citizens nor politicians voted in by current citizens have an immediate incentive to think long-term. That’s a reason why the U.S. debt level continues to grow and that’s a problem.
If you borrow a lot of money just to spend a lot of money without much in return, that doesn’t work. Spending money you don’t have to win over current voters, whether through benefits or tax cuts, doesn’t work. This results in debt as a % of GDP growing over time, which is what has been happing in the U.S. This isn’t good.
If you borrow a lot of money to invest in high quality outcomes that can generate higher revenues that outpace the original borrowing costs, that can work. This can result in debt as a % of GDP declining, which is great.
Republicans believe they can reduce the level of U.S. debt through stronger U.S. economic growth and lower government spending, benefiting U.S. citizens. Let’s hope they’re correct and can actually do it. Otherwise, current younger and future U.S. citizens may be in a tougher situation than we are in now.
Think For Yourself: Was taking on more U.S. debt worth where we are today? Did prior promises from past political parties in power (White House and Congress) in regards to economic growth and government revenues come to fruition? Are future citizens better or worse off based on the amount of U.S. debt we currently have? Do you think the new political leadership can actually reduce the U.S. debt as a % of GDP?
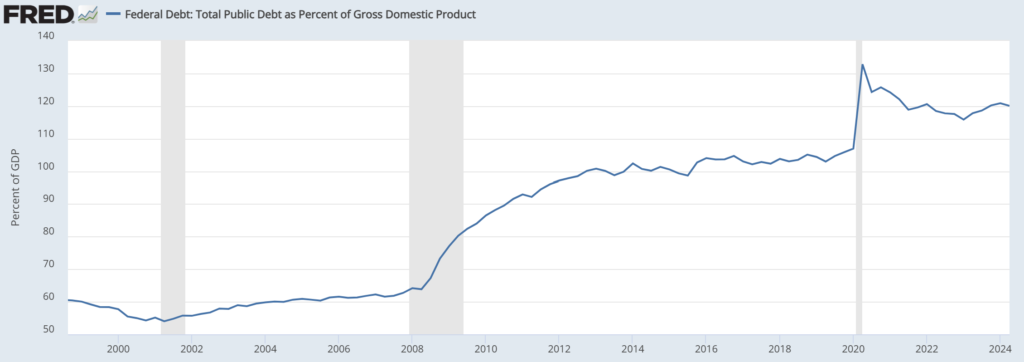
U.S. debt is easy to monitor, so let’s watch the U.S. debt as a % of GDP and see where it goes from here…
U.S. Debt as % of GDP: 120% (Q2 2024)
Interest Rates
The U.S. Federal Reserve controls the fed funds rate, which is an overnight interest rate banks charge to other banks. Your credit card interest rates are variable and generally follow the movements in the fed funds rate.
Just because the Fed cuts interest rates doesn’t mean mortgage and car loan rates will go down. You need to understand this.
Interest rates longer than the overnight fed funds rate, such as interest rates on U.S. Treasuries that go out months, a year, 5 years, 10 years, 30 years, etc. are controlled by bond investors. Bond investors require a particular yield to be attractive enough to buy those bonds and hold until maturity.
Like just inflation, interest rates are determined based on investors’ demand for bonds versus the available supply of bonds with an attractive return potential.
- Demand for Bonds > Supply of Bonds = Lower Yields (Interest Rates)
- Demand for Bonds < Supply of Bonds = Higher Yields
Many large consumer/business loans are fixed rate loans and are generally paid over a period of years. If you’re paying attention to your mortgage rate or rates on car loans, etc., then you need to pay attention to the Treasury yield curve, not just the Fed and the fed funds rate.
Just remember, the Fed controls the fed funds rate and influences your credit card rates and other variable loan rates. Bond investors generally control the rates across the Treasury yield curve (based on supply and demand) which influences your fixed rate home mortgage and auto loan rates.
Bond investors generally look at two things when determining interest rates that are attractive enough for them to buy a bond: future inflation and the ability of the bond issuer to pay back principal at maturity. Bond investors want bond yields higher than inflation and to get their principal back.
As it pertains to U.S. interest rates and the rates on your loans (home, auto, etc.), interest rates will be driven by anticipated future inflation and the ability of the U.S. to pay back the principal on the bonds.
Trump indicated that he will bring interest rates down. Remember, the Fed determines the fed funds rate and bond investors determine the rates on the yield curve. The U.S. president does not directly control interest rates. Trump will have not have control over interest rates, but the results of his economic policies can influence inflation and U.S. debt levels, which do in turn, impact the level of interest rates.
For interest rates to decline from current levels, bond investors need to believe that inflation will decline in the future. Trump stated that he would reduce prices, so maybe inflation will come down, which can reduce interest rates needed by bond investors. Trump also stated that U.S. debt will come down as well, which would also bring down the interest rates needed by investors.
At least as it stands right now, pay attention to interest rates across the yield curve. If bond investors believe Republican policies can reduce inflation and reign in U.S. debt levels, then interest rates along the yield curve could move lower. If bond investors don’t believe in the policies, then interest rates may stay within the current trading range or even move higher.
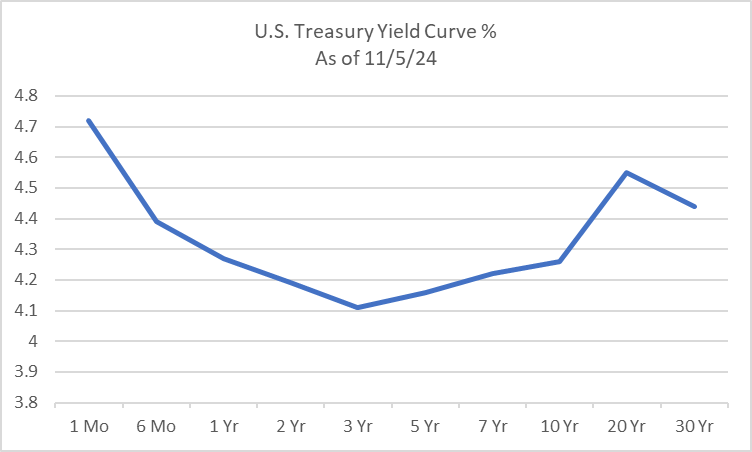
So how do we track interest rates? Again, you follow the yield curve. Investors often reference the 10-year U.S. Treasury yield to compare levels of interest rates. The 10-year Treasury yield is right around 4.40%, so we can compare that over time.
Here’s the yield curve as of the day of the election. I like to use the day of the election as the starting point so moves in the financial markets after the election is attributable to the results of the election. Remember, investors and as a result, the markets, try to anticipate the future, including future potential policies of those in political office.
If you’re interested in following interest rates across the Treasury yield curve over time, feel free to go here…
To keep it simple, you can just keep an eye on the 10-year and 30-year Treasury yields, or just keep checking mortgage and car loan rates offered by your local bank. These yields/rates can give you a decent idea of bond investors’ views of anticipated future inflation and U.S. debt levels.
Think For Yourself: Quick test: Who generally controls the fed funds rate and who controls the interest rates that generally impact longer-term consumer/business loans?
Stock Market
Here’s my reminder to investors to try to not allow the emotions of politics impact their investment decisions: Don’t Let the Emotions of Politics Impact Your Investment Decisions from November 16, 2024.
Trump seems to focus on the stock market as a barometer of success. U.S. equity markets reached new highs in 2024, so Trump would probably like to see this continue during his presidency.
Tracking the stock market is simple, we’ll just follow the performance of a couple of U.S. stock indices over time.
Since investors try to anticipate any economic policy and the resulting data before it even happens, we’ll use the value of the S&P 500 on the day of the election as a starting point. This gives Trump the rally from the election forward.
S&P 500 Index Market Close: 5,782.76 (November 5, 20204)
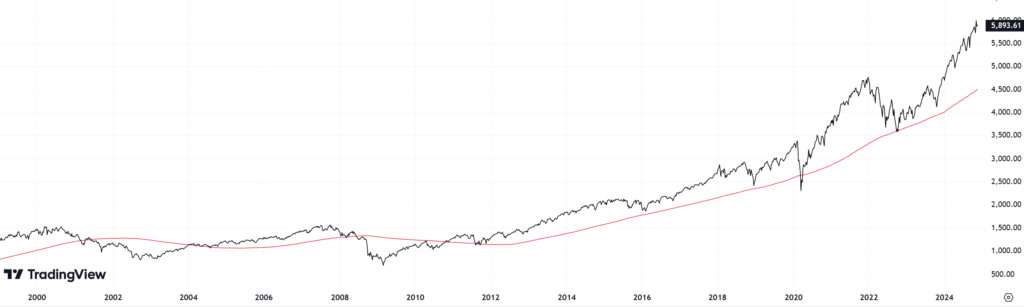
If the economy is strong, profit margins are high, revenues are high, maybe the S&P 500 index could continue to go higher. The S&P 500 has rallied pretty substantially the last two years and valuations are a bit stretched, but we’ll keep an eye on a couple of stock indices from here.
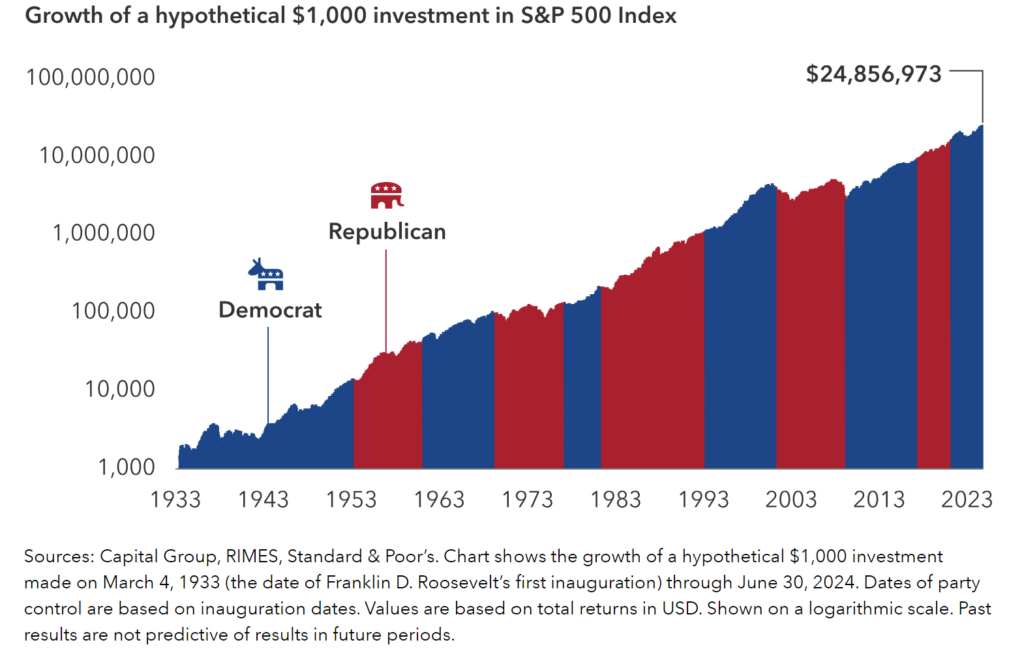
As stated in my Q3 2024 Quarterly Market Update, investors would have been rewarded by staying the course and remain invested in the S&P 500 Index through different periods of political party presidential leadership. Just something to remember as the political noise continues over the short term. So even if you don’t agree with the current political leadership, try to focus on investing for the long term.
Summary
As previously stated, I can’t stand politicians overpromising things and drastically underdelivering. It’s also tough knowing that many U.S. citizens lack financial and economic literacy, so politicians from all sides can say things that may or may not make economic sense and people still will believe them.
I don’t know what policies will be enacted by the White House and Congress. Maybe everything will pass easily. Maybe there will be infighting within the Republican party and policies won’t be easily enacted. Maybe the policies will translate to a period of economic strength for the U.S. relative to the rest of the world. Maybe not.
I’m an American citizen and I just want the best for all Americans. So for you, as an American citizen, at least do your civic duty and try to at least learn a little bit about economics. Blindly following the lead of politicians and what they say isn’t the way to do it. Educate yourself!
So understand the policies, have a view on the impact of those policies and keep an eye on the data.
Let’s all just hope for the best!